. 2011 Jun 10;286(23):20569-81.
doi: 10.1074/jbc.M111.220962. Epub 2011 Apr 13.

Early growth response 1 (Egr-1) regulates phosphorylation of microtubule-associated protein tau in mammalian brain

Affiliations

Early growth response 1 (Egr-1) regulates phosphorylation of microtubule-associated protein tau in mammalian brain

Yifan Lu et al. J Biol Chem. .

Abstract

In the normal brain, tau protein is phosphorylated at a number of proline- and non-proline directed sites, which reduce tau microtubule binding and thus regulate microtubule dynamics. In Alzheimer disease (AD), tau is abnormally hyperphosphorylated, leading to neurofibrillary tangle formation and microtubule disruption, suggesting a loss of regulatory mechanisms controlling tau phosphorylation. Early growth response 1 (Egr-1) is a transcription factor that is significantly up-regulated in AD brain. The pathological significance of this up-regulation is not known. In this study, we found that lentivirus-mediated overexpression of Egr-1 in rat brain hippocampus and primary neurons in culture activates proline-directed kinase Cdk5, inactivates PP1, promotes tau phosphorylation at both proline-directed Ser(396/404) and non-proline-directed Ser(262) sites, and destabilizes microtubules. Furthermore, in Egr-1(-/-) mouse brain, Cdk5 activity was decreased, PP1 activity was increased, and tau phosphorylation was reduced at both proline-directed and non-proline-directed sites. By using nerve growth factor-exposed PC12 cells, we determined that Egr-1 activates Cdk5 to promote phosphorylation of tau and inactivates PP1 via phosphorylation. When Cdk5 was inhibited, tau phosphorylation at both proline- and non-proline directed sites and PP1 phosphorylation were blocked, indicating that Egr-1 acts through Cdk5. By using an in vitro kinase assay and HEK-293 cells transfected with tau, PP1, and Cdk5, we found that Cdk5 phosphorylates Ser(396/404) directly. In addition, by phosphorylating and inactivating PP1, Cdk5 promotes tau phosphorylation at Ser(262) indirectly. Our results indicate that Egr-1 is an in vivo regulator of tau phosphorylation and suggest that in AD brain increased levels of Egr-1 aberrantly activate an Egr-1/Cdk5/PP1 pathway, leading to accumulation of hyperphosphorylated tau, thus destabilizing the microtubule cytoskeleton.


Figures

FIGURE 1.
FIGURE 1.
Lentivirus-mediated Egr-1 overexpression in rat brain hippocampus. The human Egr-1 gene was subcloned into a lentiviral vector that independently expressed Myc-Egr-1 and GFP. Lentiviruses expressing Egr-1 (Ln-Egr-1) and vector (Ln-vector) were produced and injected into the hippocampus of rat brain (three in each group). The hippocampus of each rat was isolated and analyzed either by Western blot analysis or immunohistochemistry. A, schematic diagram of viral constructs used in rat brain injections and infection of rat primary hippocampal neurons. B, Western blot analysis of HEK-293 cells infected with the indicated virus. C, Western blot analysis of hippocampal extracts of the indicated rats injected with the indicated virus. Anti-Myc antibody confirms the expression of virally encoded transgenic Myc-Egr-1, whereas anti-Egr-1 antibody monitors total Egr-1 protein. D, relative amount of Egr-1 in virus-injected hippocampal extract. The relative amount of total Egr-1 was calculated by normalizing the total Egr-1 band intensity value of each sample in C against the respective actin band. Values are mean ± S.E. from three brain samples in each group. *, p < 0.05 (t test). E–M, immunohistochemistry. Hippocampal sections injected with the indicated virus were observed under a fluorescence microscope for GFP immunofluorescence to monitor virally mediated gene expression or immunostained with anti-Myc (Myc-Egr-1) to monitor the expression of transgenic Myc-Egr-1. E–M, hippocampal sections of injected rats showing GFP or Myc (Myc-Egr-1) immunofluorescence, DAPI (nucleus), and merge (co-localization). The arrowheads show the injection site in the Ln-Egr-1 rat brain section. Scale bars, 200 μm in E and 50 μm in F–M. Note that we could not detect GFP epifluorescence from brain sections and neurons in culture infected with virus; hence, we visualized GFP by immunofluorescence with an anti-GFP antibody. EGFP, enhanced GFP; IRES, internal ribosome entry site.
FIGURE 2.
FIGURE 2.
Egr-1 overexpression promotes tau phosphorylation in rat hippocampus. Ln-Egr-1- or Ln-vector-injected rats were further analyzed by immunohistochemistry and Western blot analysis. A, immunohistochemistry. Hippocampal sections of rats injected with Ln-Egr-1 or Ln-vector were stained with PHF-1 or AT8 antibody. The corresponding inset of each left-hand panel is shown at high magnifications on the right-hand side. Scale bars, 400 μm in the left-hand panel and 100 μm in the right-hand panel. B, Western blot analysis. Hippocampal extracts from rats injected with Ln-Egr-1 and Ln-vector (n = 3 per group) using Tau 5 (total tau), PHF-1, AT8, and 12E8 antibodies. Lower panel, relative amounts. The relative amount of total tau was calculated by normalizing the Tau 5 band with the respective actin band. Relative tau phosphorylation at the PHF-1, AT8, or 12E8 site was calculated by normalizing the PHF-1, AT8, or 12E8 band intensity value with the corresponding Tau 5 band intensity value. Values are the mean ± S.E. from three brain samples in each group. *, p < 0.005; **, p > 0.001 (t test).
FIGURE 3.
FIGURE 3.
Identification of kinase activated in rat hippocampus injected with Ln-Egr-1. Each rat brain hippocampus injected with Ln-Egr-1 or Ln-vector was individually homogenized, and each homogenate was subjected to a kinase assay using a peptide substrate that was directed to the indicated kinases or analyzed by Western blot analysis using the indicated antibodies. A, relative kinase activity. The specific activity of a kinase in each sample was determined and normalized against the specific activity value of that kinase in the Ln-vector-injected hippocampus. Values are the mean ± S.E. from three hippocampal extracts in each group. B, Western blots. C, relative amounts. The relative amounts of various proteins were determined as in Fig. 2 from the Western blot representing B. To calculate the relative phosphorylation of GSK3α or GSK3β, the average band intensity value of phosphorylated GSK3α or GSK3β was normalized against the respective total GSK3α or GSK3β band intensity value. Values are the mean ± S.E. from three hippocampal extracts in each group. *, p > 0.05 (t test). pGSK3, phosphorylated GSK3; CamK II, Ca2+/calmodulin-dependent protein kinase II.
FIGURE 4.
FIGURE 4.
Cdk5 phosphorylates tau in NGF-exposed PC12 cells. PC12 cells were exposed to NGF for the indicated time points. At day 5, the cells were treated with the Cdk5 inhibitor olomoucine or vehicle for 1 h and then subjected to Western blot analysis. Based on blot band intensities, the relative amounts of various proteins were determined as in Fig. 2. A, Western blots. B, relative amounts. Values are the mean ± S.E. from three determinations. *, p > 0.05 with respect to day 0 cells (t test); **, p > 0.05 with respect to vehicle-treated cells (t test). Olo, olomoucine.
FIGURE 5.
FIGURE 5.
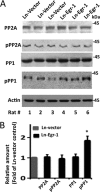
PP1 is inactivated in Egr-1-overexpressing rat hippocampus. Extracts of the indicated virus-injected rat hippocampus were subjected to Western blotting using the indicated antibodies. Based on the band intensities, the relative amounts of various proteins on the blot were determined. A, Western blots. B, relative amounts. The values are the mean ± S.E. from three hippocampal extracts in each group. *, p > 0.005 (t test). pPP1, phosphorylated PP1; pPP2A, phosphorylated PP2A.
FIGURE 6.
FIGURE 6.
Deletion of Egr-1 function reduces phosphorylation of tau and PP1 in mouse brain. Fresh mouse brains of the indicated genotype (n = 3 per group) were homogenized, and each homogenate was subjected to Western blot analysis using the indicated antibodies. A, Western blots. B, relative amounts. Relative amounts were determined from the band intensities of the respective proteins in A as in Fig. 2. Values are the mean ± S.E. from three brain samples in each group and are expressed as the -fold of Egr-1+/+ control. *, p < 0.001; **, p < 0.05 with respect to Egr-1+/+ control (t test). pPP1, phosphorylated PP1.
FIGURE 7.
FIGURE 7.
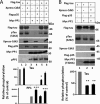
Cdk5 promotes tau phosphorylation at Ser262 by phosphorylating and inactivating PP1 in HEK-293 cells. HEK-293 cells were co-transfected with FLAG-tau, Xpress-Cdk5, FLAG-p35, Myc-PP1, or Myc-PP1 (T320A) in different combinations as indicated. Transfected cells were lysed and analyzed by Western blot analysis. Anti-Xpress, anti-FLAG, and anti-Myc blots monitor the expression of the respective tagged genes. Note that both tau and p35 are FLAG-tagged. On the SDS gel, FLAG-tau and FLAG-p35 migrate as 68 and 35 kDa bands, respectively, and can be identified based on their size on the same anti-FLAG Western blot. Western blots in each panel were used to generate respective relative amount values. Values are mean ± S.E. from three determinations. *, p < 0.005; **, p < 0.001 with respect to cells expressing only FLAG-tau (t test); ***, p > 0.02 with respect to cells expressing only Myc-PP1 (t test). pTau, phosphorylated tau; pPP1, phosphorylated PP1.
FIGURE 8.
FIGURE 8.
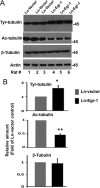
Egr-1 overexpression destabilizes microtubules in rat hippocampus. Hippocampal extracts of rats injected with Ln-Egr-1 or Ln-vector were analyzed by Western blot analysis using antibody directed to Tyr-tubulin, Ac-tubulin, β-tubulin, or actin. Based on blot band intensities, relative amounts of various proteins were determined. A, Western blots. B, relative amounts. The relative amount of Tyr-tubulin and Ac-tubulin was determined by normalizing the Tyr-tubulin or Ac-tubulin band intensity of a sample against the respective β-tubulin band. To determine the relative amount of tubulin, the β-tubulin band of a sample was normalized against the respective actin band. Values with the mean ± S.E. are from three hippocampal extracts in each group. *, p > 0.05; **, p > 0.001 (t test).
FIGURE 9.
FIGURE 9.
Overexpression of Egr-1 in rat hippocampal primary neurons in culture promotes tau phosphorylation but does not change tau distribution. Rat primary neurons in culture were infected with the indicated virus and then analyzed by either Western blot analysis or immunocytochemistry. A, Western blots. B, relative amounts. The relative amount of phosphorylated tau was determined as in Fig. 2 using a Western blot representing A. Values are the mean ± S.E. from three independent cultures. *, p > 0.05 (t test). C and D, immunocytochemistry. Shown are infected neurons stained for PHF-1 (phosphorylated tau), Myc (Myc-Egr-1), DAPI (nucleus), Tau 5 (total tau), and merge (co-localization). Scale bars, 15 μm.
FIGURE 10.
FIGURE 10.
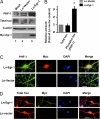
Egr-1 overexpression causes microtubule instability in rat primary hippocampal neurons in culture. Rat primary hippocampal neurons infected with the indicated virus were analyzed by either Western blot analysis or immunocytochemistry. A, representative Western blot of extracts of neurons infected with Ln-Egr-1 or Ln-vector using antibodies against unstable microtubules (Tyr-tubulin), stable microtubules (Ac-tubulin), and total tubulin (β-tubulin). B, the relative amounts determined from Western blots representing A as in Fig. 8. Values are the mean ± S.E. from three different cultures. *, p < 0.03; **, p < 0.005 (t test). C and D, immunocytochemistry. Shown are Ln-vector- or Ln-Egr-1-infected neurons stained for Tyr-tubulin, Myc (Myc-Egr-1), β-tubulin, and merge (co-localization). Scale bar, 15 μm. E and F, the indicated virus-infected neurons were treated with the Cdk5 inhibitor roscovitine (rosco) or vehicle and then analyzed by Western blot analysis. E, Western blot. F, relative amount. The relative amounts of phosphorylated tau and Tyr-tubulin were determined as in B. *, p < 0.005 (t test).

Similar articles

Cited by

References

    1. Brunden K. R., Trojanowski J. Q., Lee V. M. (2009) Nat. Rev. Drug Discov. 8, 783–793 - PMC - PubMed
    1. Hanger D. P., Anderton B. H., Noble W. (2009) Trends Mol. Med. 15, 112–119 - PubMed
    1. Lee V. M., Goedert M., Trojanowski J. Q. (2001) Annu. Rev. Neurosci. 24, 1121–1159 - PubMed
    1. Hardy J., Selkoe D. J. (2002) Science 297, 353–356 - PubMed
    1. Rapoport M., Dawson H. N., Binder L. I., Vitek M. P., Ferreira A. (2002) Proc. Natl. Acad. Sci. U.S.A. 99, 6364–6369 - PMC - PubMed

Publication types

MeSH terms