. 2011 Jun 10;286(23):20710-26.
doi: 10.1074/jbc.M110.213538. Epub 2011 Apr 13.

Direct membrane association drives mitochondrial fission by the Parkinson disease-associated protein alpha-synuclein

Affiliations

Direct membrane association drives mitochondrial fission by the Parkinson disease-associated protein alpha-synuclein

Ken Nakamura et al. J Biol Chem. .

Abstract

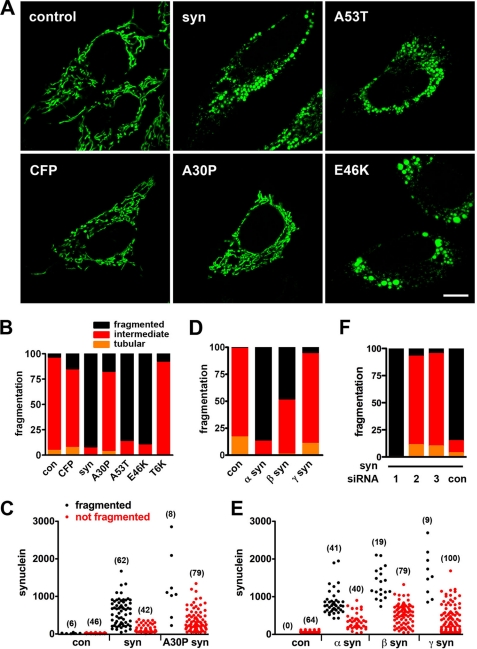
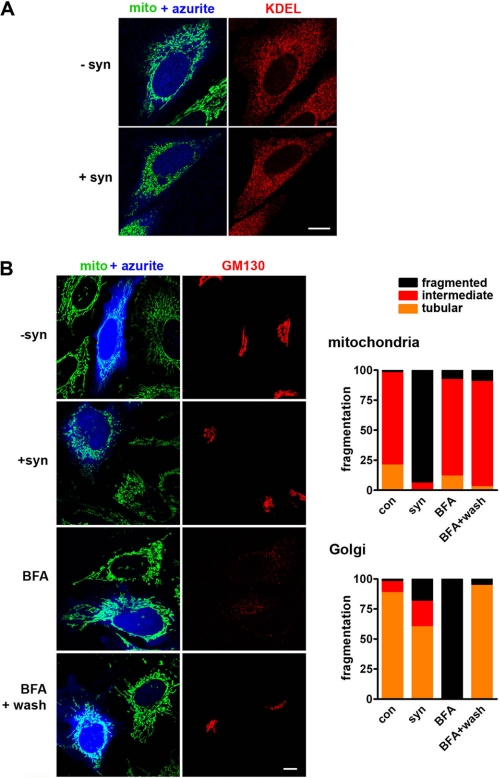
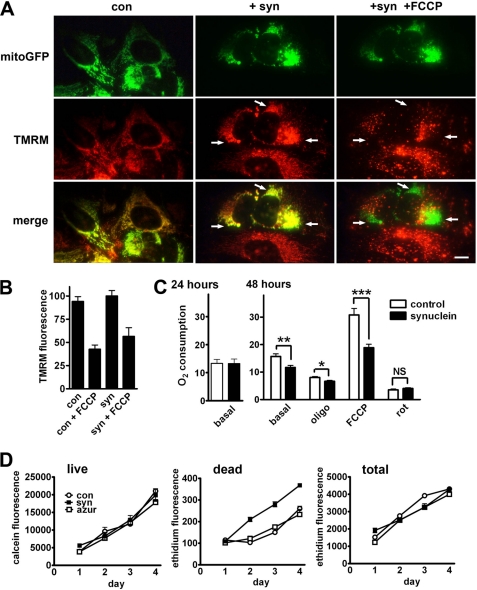
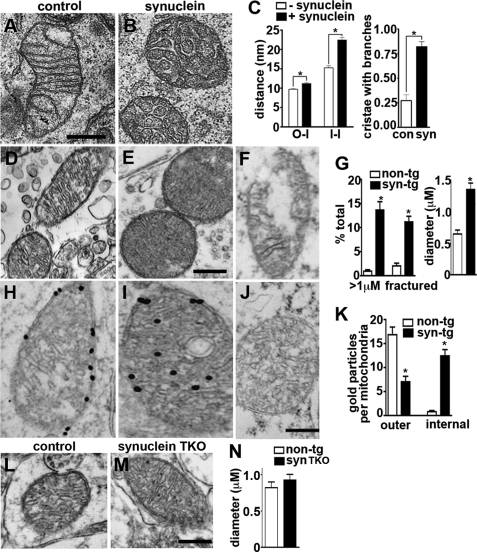
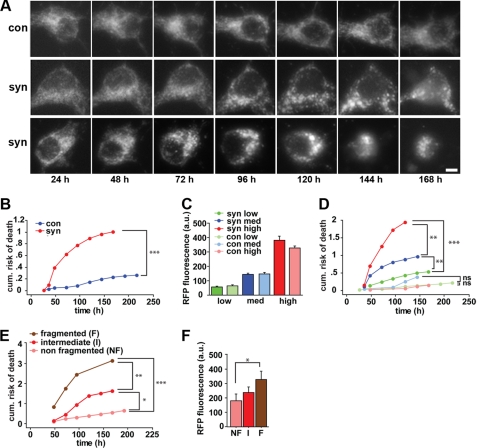
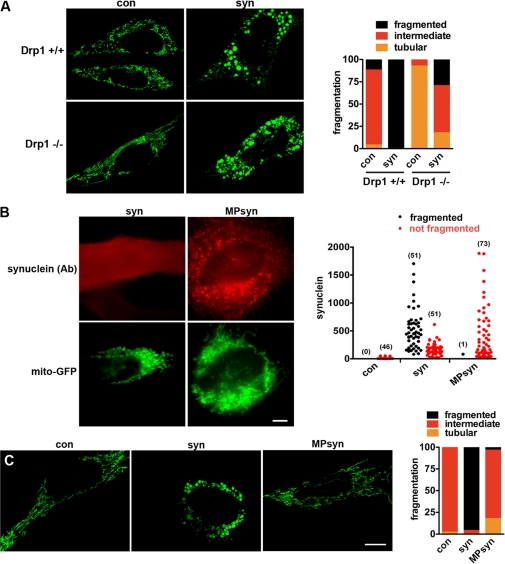
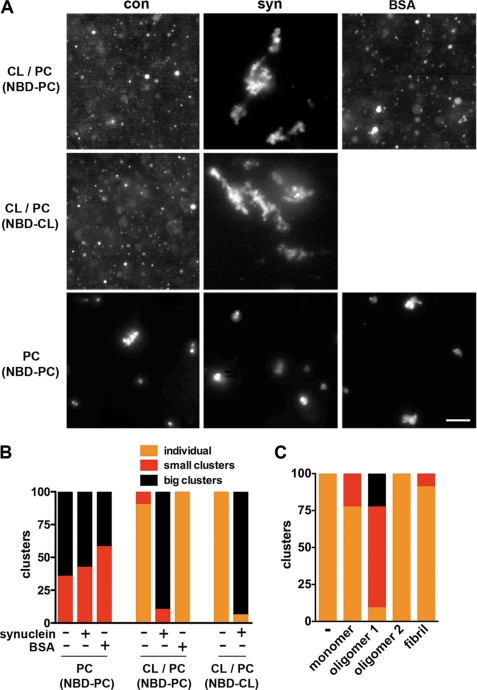
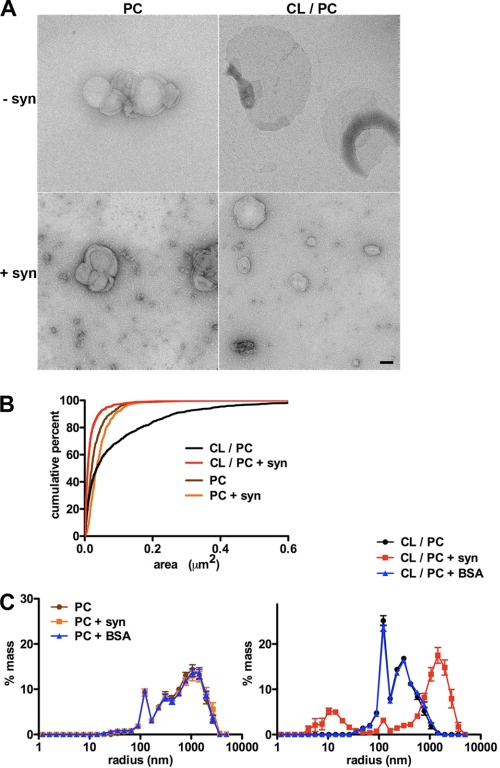
The protein α-synuclein has a central role in Parkinson disease, but the mechanism by which it contributes to neural degeneration remains unknown. We now show that the expression of α-synuclein in mammalian cells, including neurons in vitro and in vivo, causes the fragmentation of mitochondria. The effect is specific for synuclein, with more fragmentation by α- than β- or γ-isoforms, and it is not accompanied by changes in the morphology of other organelles or in mitochondrial membrane potential. However, mitochondrial fragmentation is eventually followed by a decline in respiration and neuronal death. The fragmentation does not require the mitochondrial fission protein Drp1 and involves a direct interaction of synuclein with mitochondrial membranes. In vitro, synuclein fragments artificial membranes containing the mitochondrial lipid cardiolipin, and this effect is specific for the small oligomeric forms of synuclein. α-Synuclein thus exerts a primary and direct effect on the morphology of an organelle long implicated in the pathogenesis of Parkinson disease.


Figures

FIGURE 1.
FIGURE 1.
Synuclein produces mitochondrial fragmentation in HeLa cells. A and B, HeLa cells were cotransfected with cDNAs encoding azurite (to identify transfected cells), mitoGFP (to identify mitochondria), and either empty vector control, CFP, wild type α-synuclein (syn), A30P, A53T, or E46K α-synuclein. 48 h after transfection, cells were selected on the basis of azurite fluorescence and imaged live; the images were randomized, and mitochondrial morphology was classified as fragmented, tubular, or intermediate blind to the genotype of transfection. Scale bar indicates 10 μm. The bar graph (B) shows the percentage of cells in each group. Wild type, A53T, and E46K α-synuclein produce mitochondrial fragmentation not observed in control (con), CFP, A30P, and T6K (replacement of Thr-22, Thr-33, Thr-44, Thr-59, Thr-81, and Thr-92 with lysines) synuclein, p < 0.0001 by χ2 analysis. n = 33–41 cells per group from two independent transfections. C, cells transfected as above were also fixed and immunostained for α-synuclein, and those with a range of synuclein levels (selected blind to mitochondrial morphology) were imaged and classified in terms of mitochondrial morphology. The number of cells in each group is indicated in parentheses. D and E, effects of α-, β-, and γ-synuclein on mitochondrial morphology were assessed the same way in live HeLa cells and in fixed cells immunostained for synuclein (E). α- and β-synuclein produce mitochondrial fragmentation (p < 0.0001), whereas γ-synuclein does not (D). n = 39–50 cells per group from three independent transfections. F, cells were cotransfected with synuclein and either siRNA to human synuclein (Silencer Select s13204 (1), s13205 (2), and s13206 (3)) or control siRNA (Silencer Select negative control 1 (con)). siRNA2 and -3 (but not siRNA1 or control siRNA) effectively reduce synuclein expression (supplemental Fig. S3) and block mitochondrial fragmentation (n = 18–27 cells per group from two independent transfections, p < 0.0001).
FIGURE 2.
FIGURE 2.
α-Synuclein does not substantially affect endoplasmic reticulum or Golgi morphology. A, HeLa cells were cotransfected with cDNAs encoding azurite, mitoGFP, and either vector control (−syn) or α-synuclein (+syn). 48 h after transfection, cells were fixed, and the endoplasmic reticulum was identified by staining for the KDEL receptor. α-Synuclein has no effect on the morphology of the endoplasmic reticulum. Scale bar indicates 10 μm. B, HeLa cells stably expressing mitoGFP were cotransfected with cDNAs encoding azurite and either vector control (−syn) or α-synuclein (+syn). Control transfected cells were also treated with 5 mg/ml brefeldin A (BFA) for 60 min before imaging and then imaged again 4 h after wash out. 48 h after transfection, cells were fixed and stained for the Golgi matrix protein GM130. Random cells were classified blind to transfection in terms of mitochondrial and Golgi morphology. α-Synuclein produces mitochondrial fragmentation (p < 0.0001), whereas control, BFA, and BFA following wash do not. In contrast, BFA causes dramatic fragmentation of the Golgi complex far greater than that by synuclein (p < 0.0001), and this does not affect mitochondrial morphology. n = 24–111 cells per group from four independent transfections.
FIGURE 3.
FIGURE 3.
Mitochondrial fragmentation precedes any disturbance in mitochondrial function or toxicity. A and B, HeLa cells were transfected with mitoGFP and either empty vector control (con) or α-synuclein (+syn) and then loaded with the membrane potentially sensitive dye TMRM (1 nm) for 1 h before imaging live. Selected on the basis of GFP, TMRM fluorescence was quantified in individual cells. Treatment with the proton ionophore FCCP (2.5 μm) for 4 min before re-imaging causes a marked redistribution of TMRM fluorescence away from mitochondria (arrows). Scale bar indicates 10 μm. Quantitation of TMRM fluorescence (B) shows no effect of synuclein. The values indicate mean ± S.E. n = 12–49 cells per condition from four independent transfections. C, COS cells were transfected with either vector control or α-synuclein. 1–2 days later, oxygen consumption was measured in the basal state (10 mm glutamate and 2.5 mm malate) and, after addition of the ATP synthase inhibitor oligomycin (oligo) (1 μg/ml), the proton ionophore FCCP (1 μm) and the complex I inhibitor rotenone (rot) (500 nm). Synuclein impairs base-line respiration at 48 h but not 24 h, and the effect is greater in mitochondria uncoupled with FCCP. *, p < 0.01; **, p < 0.005; ***, p < 0.001; NS, not significant by one-way analysis of variance and Newman-Keuls post hoc test. n = 4–9 experiments per group. D, COS cells were transfected with vector control, α-synuclein, or azurite (azur), and after 16 h, replated onto 96-well plates. At 24, 48, 72, and 96 h after transfection, the cells were treated with either calcein green-AM (1 μm) to count live cells, ethidium bromide (5 μm) to count dead cells, or after 70% methanol followed by ethidium bromide to count total cells. α-Synuclein also has no effect on cell survival at 24 h, when fragmentation has already occurred in essentially all cells (supplemental Fig. S8B). By 48 h, however, there is a small increase in the number of dying cells that persists for the duration of the experiment (p < 0.01 versus control and azurite at 48, 72, and 96 h by one-way analysis of variance and Newman-Keuls post hoc test). Data show mean ± S.E., n = 6 wells per group.
FIGURE 4.
FIGURE 4.
Synuclein disrupts mitochondrial ultrastructure. A–C, COS cells were transfected with mitoGFP and either vector control or α-synuclein and sorted at 18 h for GFP fluorescence, and cells falling into the top quartile of expression were plated onto aclar discs. Cultured for an additional 6 h, the cells were fixed in 2.5% glutaraldehyde and examined by electron microscopy. A and B, α-synuclein disrupts mitochondrial ultrastructure. Scale bar indicates 500 nm. C, random collection of mitochondria were analyzed for the distances between the outer and inner mitochondrial membranes (O-I) and between adjacent inner membranes (I-I), and the data presented as mean ± S.E., n = 138–176 for O-I, and 222–335 for I-I. C, synuclein also increases the proportion of cristae that branch at least once while traversing the diameter of the mitochondrion. Bars indicate mean ± S.E., n = 55–56 cristae per group from two independent transfections. *, p < 0.01 by two one-way analysis of variance and Newman-Keuls post hoc test. con, control. D–G, ultrastructural analysis shows mitochondria with well organized cristae in the midbrain neurons of 6-month-old nontransgenic mice (D), but disorganized cristae in the mitochondria of α-synuclein transgenic (tg) mice (E). α-Synuclein transgenic mitochondria also show an increase in cross-section diameter (D, E, and G) and discontinuous (fractured) outer membranes (F and G). *, p < 0.01 by unpaired two-tailed Student's t test (n = 4 per group). The size bar indicates 0.25 μm. H–J, immunoelectron microscopy for α-synuclein in the midbrain neurons of 6-month nontransgenic (H) and α-synuclein transgenic (I) mice shows 10 nm gold particles in association with the circumferential membranes of non-transgenic mitochondria, with no labeling by IgG control (J). In synuclein transgenic mice, however, most of the gold particles localize to internal membranes. The bar graph (K) indicates the distribution of gold particles over outer and internal mitochondrial membranes. *, p < 0.01 by unpaired two-tailed Student's t test (n = 4 per group). The size bar indicates 0.5 μm. L–N, ultrastructural analysis shows no difference in the morphology of mitochondria in midbrain neurons from control versus synuclein TKO mice. The size bar indicates 0.5 μm.
FIGURE 5.
FIGURE 5.
Mitochondrial fragmentation by synuclein precedes neuronal death. Rat hippocampal neurons were transfected 5 days after plating with mRFP and either α-synuclein (syn) or vector control (con) (A–F), without or with mitoGFP (A, E, and F). MitoGFP (A) or mRFP (not shown) were then imaged on a daily basis using an automated microscope. Scale bar is 10 μm. B, cumulative risk of death curves indicate that primary neurons expressing synuclein have a significantly greater risk of death than control cells (***, p < 0.0001, log-rank test). n = 112–115 neurons per group. The experiment was repeated three times with similar results. C, mRFP fluorescence of individual neurons was measured 24 h after transfection and used as a surrogate for synuclein expression. Based on mRFP fluorescence, neurons were stratified into three expression groups (low, medium, and high). a.u., arbitrary units of fluorescence. Within each of these groups, synuclein (dark) and control (light) transfected neurons showed no significant difference in mRFP fluorescence. D, cumulative risk of death curves indicates that neurons expressing higher levels of synuclein (red and blue) have a dose-dependent greater risk of death than controls expressing equivalent mRFP. **, p < 0.005; ***, p < 0.0001; ns, not significant, n = 22–46 neurons per group. E, cumulative risk of death curves show that neurons with fragmented mitochondria at 48 h have a progressively greater risk of death than neurons displaying intermediate or nonfragmented mitochondria (*, p < 0.05; **, p < 0.005; ***, p < 0.001). E and F, neurons with fragmented mitochondria express progressively higher levels of synuclein (*, p < 0.05).
FIGURE 6.
FIGURE 6.
Synuclein fragments mitochondria through a direct interaction independent of Drp1. A, immortalized Drp1 KO and control mouse embryonic fibroblasts were cotransfected with cDNAs encoding azurite (to identify transfected cells), mitoGFP (to identify mitochondria), and either empty vector control (con) or wild type α-synuclein (syn). Forty eight hours after transfection, cells were selected on the basis of azurite fluorescence and imaged live, and the images were randomized, and mitochondrial morphology was classified as fragmented, tubular, or intermediate blind to the genotype of transfection. Scale bar indicates 10 μm. The bar graph shows the percentage of cells in each group. At base line, cells lacking Drp1 have more tubulated mitochondria (p < 0.0001). However, synuclein produces robust mitochondrial fragmentation even in the absence of Drp1 (p < 0.0001). n = 13–34 cells per group from two independent transfections. B and C, HeLa cells were cotransfected with azurite (to identify transfected cells), mitoGFP (to identify mitochondria), and either untagged α-synuclein (syn) or α-synuclein targeted to the secretory pathway by fusion to the N-terminal myristoylation/palmitoylation signal of Lyn kinase (MPsyn). B, 48 h after transfection, cells were fixed and immunostained for α-synuclein, and those with a range of synuclein levels (selected blind to mitochondrial morphology) imaged and classified in terms of mitochondrial morphology. The number of cells in each group is indicated in parentheses. In contrast to syn, MPsyn fails to fragment mitochondria even when expressed at high levels. C, cells were selected on the basis of azurite fluorescence and imaged live, and the images were randomized and mitochondrial morphology was classified as fragmented, tubular, or intermediate blind to the genotype of transfection. Scale bar indicates 10 μm. The bar graph shows the percentage of cells in each group. syn fragments mitochondria (p < 0.0001), whereas control and MPsyn do not. n = 28–50 cells per group from two independent transfections.
FIGURE 7.
FIGURE 7.
Recombinant, oligomeric α-synuclein clusters artificial membranes. A, artificial liposomes containing either CL and PC (1:1) or PC alone were incubated for 5 min without protein, with a combination of monomeric and trimeric synuclein (0.3 mg/ml), or with BSA (0.6 mg/ml), and the fluorescence of trace NBD conjugated to the N terminus of either 1,2-dioleoyl-sn-glycero-3-phosphocholine or heart cardiolipin (NBD-CL) visualized by light microscopy. Scale bar indicates 10 μm. B, quantitative analysis of liposome clustering. Individual indicates that essentially all liposomes in a field are isolated; small clusters indicate 2–10 liposomes per cluster, and big clusters indicates more than 10 liposomes per cluster. Liposomes containing CL and PC alone or with BSA remain isolated and in many cases flatten onto the substrate. In the presence of synuclein, however, large clusters form rapidly (p < 0.0001 versus control for CL/PC liposomes). Synuclein has no effect on liposomes containing PC alone. n = 21–22 fields per group. C, CL liposomes were incubated with 80 μm synuclein monomer, small oligomer (oligomer 1), mature oligomer (oligomer 2), or fibrils, and the extent of clustering was quantified. Only oligomer 1 results in clustering (p < 0.0001). 17–20 fields per group.
FIGURE 8.
FIGURE 8.
Recombinant synuclein drives the fission of artificial membranes. A, liposomes were incubated for 5 min at room temperature in the presence or absence of synuclein (20 μm, monomeric and trimeric) and visualized by EM. Scale bar indicates 100 nm. B, random fields of isolated liposomes were photographed, and their areas were quantified. Cumulative frequency distribution shows that synuclein reduces the mean area for those containing CL/PC but not those with PC alone. n = 263–1768 liposomes per group. C, analysis by light scattering shows that synuclein (0.3 mg/ml) but not BSA (0.3 mg/ml) causes the emergence of two liposome populations, one smaller than the original, and the other larger. The graphs indicate mean ± S.E., n = 11–12 wells per group from three independent experiments.

References

    1. Schapira A. H., Mann V. M., Cooper J. M., Dexter D., Daniel S. E., Jenner P., Clark J. B., Marsden C. D. (1990) J. Neurochem. 55, 2142–2145 - PubMed
    1. Bender A., Krishnan K. J., Morris C. M., Taylor G. A., Reeve A. K., Perry R. H., Jaros E., Hersheson J. S., Betts J., Klopstock T., Taylor R. W., Turnbull D. M. (2006) Nat. Genet. 38, 515–517 - PubMed
    1. Valente E. M., Abou-Sleiman P. M., Caputo V., Muqit M. M., Harvey K., Gispert S., Ali Z., Del Turco D., Bentivoglio A. R., Healy D. G., Albanese A., Nussbaum R., González-Maldonado R., Deller T., Salvi S., Cortelli P., Gilks W. P., Latchman D. S., Harvey R. J., Dallapiccola B., Auburger G., Wood N. W. (2004) Science 304, 1158–1160 - PubMed
    1. Narendra D., Tanaka A., Suen D. F., Youle R. J. (2008) J. Cell Biol. 183, 795–803 - PMC - PubMed
    1. Polymeropoulos M. H., Lavedan C., Leroy E., Ide S. E., Dehejia A., Dutra A., Pike B., Root H., Rubenstein J., Boyer R., Stenroos E. S., Chandrasekharappa S., Athanassiadou A., Papapetropoulos T., Johnson W. G., Lazzarini A. M., Duvoisin R. C., Di Iorio G., Golbe L. I., Nussbaum R. L. (1997) Science 276, 2045–2047 - PubMed

Publication types

MeSH terms