. 2011 Nov 7;8(64):1574-83.
doi: 10.1098/rsif.2011.0086. Epub 2011 Apr 13.

Effect of skin hydration on the dynamics of fingertip gripping contact

Affiliations

Effect of skin hydration on the dynamics of fingertip gripping contact

T André et al. J R Soc Interface. .

Abstract

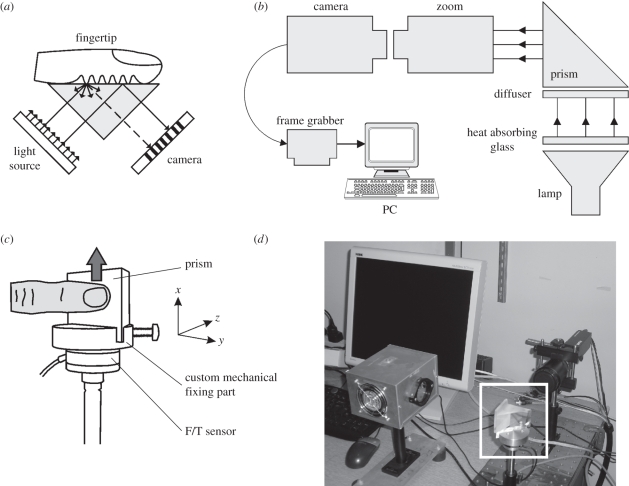
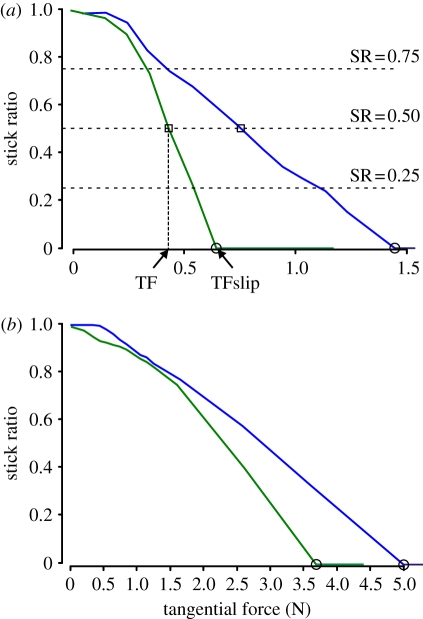
The dynamics of fingertip contact manifest themselves in the complex skin movements observed during the transition from a stuck state to a fully developed slip. While investigating this transition, we found that it depended on skin hydration. To quantify this dependency, we asked subjects to slide their index fingertip on a glass surface while keeping the normal component of the interaction force constant with the help of visual feedback. Skin deformation inside the contact region was imaged with an optical apparatus that allowed us to quantify the relative sizes of the slipping and sticking regions. The ratio of the stuck skin area to the total contact area decreased linearly from 1 to 0 when the tangential force component increased from 0 to a maximum. The slope of this relationship was inversely correlated to the normal force component. The skin hydration level dramatically affected the dynamics of the contact encapsulated in the course of evolution from sticking to slipping. The specific effect was to reduce the tendency of a contact to slip, regardless of the variations of the coefficient of friction. Since grips were more unstable under dry skin conditions, our results suggest that the nervous system responds to dry skin by exaggerated grip forces that cannot be simply explained by a change in the coefficient of friction.


Figures

Figure 1.
Figure 1.
Course of evolution of the dynamics of finger contact from the initial contact to full slip. From left to right: initial stuck contact (dark grey), preloading, slip onset starting at the trailing edge, growth of the slip region (light grey), full slip.
Figure 2.
Figure 2.
(a) Illustration of the principle of frustrated total internal reflection (FTIR) with a prism-based fingerprint imager. (b) Illustration of the optical platform. The light source was directed towards the prism and the camera recorded the reflected light. (c) Mechanical interface to record the forces applied to the prism. The task performed by the subjects is also illustrated. Subjects applied a constant normal force component and slipped in the indicated direction. (d) Picture of the complete system. Adapted from Lévesque & Hayward [26].
Figure 3.
Figure 3.
Image processing using the optical flow technique. By comparing two images, a gradient of displacement was estimated for each pixel. Black corresponds to zero displacement and grey levels correspond to the displacement magnitude (lighter colour indicates greater magnitude). Ellipses were fitted to quantify the contact region (green ellipse) and the stuck region (red ellipse).
Figure 4.
Figure 4.
Time course of the normal and tangential force components in a typical trial, associated frames and ‘optical flow images’. During the tangential preloading period (grey box), the tangential force component increased until the slip occurred (black arrow, top). Frames were selected during the preloading phase and were compared to obtain the optical flow images. The contact area is not correlated to the tangential force. The stuck area decreased when the tangential force component increased.
Figure 5.
Figure 5.
(a) Normalized contact area increased logarithmically with the normal force component. The normalized contact area was defined as the ratio between the contact area and the contact area for a normal force of 10 N. Each data point corresponds to the mean normalized contact area across all subjects. Standard deviations (vertical lines) are plotted around the corresponding means. (b) Typical trial showing the time course of the normalized contact area (black dots and curve) and the normalized stick area (grey dots and curve) for one subject applying a normal force component of 5 N. When the stuck area vanishes, the slip is fully developed (circle and dashed line). The grey box corresponds to the tangential preloading phase.
Figure 6.
Figure 6.
Relationship between the stick ratio and the tangential force for two subjects with very different hydration levels (green or blue curves) and for two normal forces (a) 0.5 N and (b) 5 N. Each curve corresponds to the mean of five trials for a given subject and a given normal force. (a) The horizontal dashed lines underline three stick ratio values (SR = 0.25, 0.5 or 0.75). The tangential force component is found where the lines cross the curves (e.g. for SR = 0.5, black squares). The tangential force component when the full slip occurs is found when the stick ratio is 0 (black circles). (b) Colours are associated with subjects: green trace for subject AG who had the driest skin and blue trace for subject GC who had the wettest skin.
Figure 7.
Figure 7.
Effect of moisture on the ratio TF/TFslip for the two subjects (a) AC and (b) FH with the largest moisture variation. All normal forces are represented and each data point corresponds to the ratio of TF/TFslip and moisture level for one trial and for a given stick ratio (SR = 0.5).
Figure 8.
Figure 8.
Effect of moisture on the ratio TF/TFslip: (a) with a different symbol and/or colour for each subject (SR = 0.5; AC, green circles; AG, black crosses; FH, black squares; GC, grey plus symbols; GT, green diamonds; MZ, blue inverted triangles; RW, blue stars; TA, purple stars; VL, red dots; VM, red plus symbols) and (b) for three stick ratio values (SR = 0.25 in green, SR = 0.50 in red and SR = 0.75 in blue). All subjects and all normal forces are represented. Each data point corresponds to the mean ratio TF/TFslip and moisture level for one normal force component value across the five trials and for a given stick ratio.

References

    1. Johansson R. S., Flanagan J. R. 2009. Coding and use of tactile signals from the fingertips in object manipulation tasks. Nat. Rev. Neurosci. 10, 345–35910.1038/nrn2621 (doi:10.1038/nrn2621) - DOI - DOI - PubMed
    1. Johansson R. S., Vallbo A. B. 1983. Tactile sensory coding in the glabrous skin of the human hand. Trends Neurosci. 6, 27–3210.1016/0166-2236(83)90011-5 (doi:10.1016/0166-2236(83)90011-5) - DOI - DOI
    1. Johansson R. S., Westling G. 1984. Roles of glabrous skin receptors and sensorimotor memory in automatic control of precision grip when lifting rougher or more slippery objects. Exp. Brain Res. 56, 550–56410.1007/BF00237997 (doi:10.1007/BF00237997) - DOI - DOI - PubMed
    1. Johnson K. O. 2001. The roles and functions of cutaneous mechanoreceptors. Curr. Opin. Neurobiol. 11, 455–46110.1016/S0959-4388(00)00234-8 (doi:10.1016/S0959-4388(00)00234-8) - DOI - DOI - PubMed
    1. Srinivasan M. A., Whitehouse J. M., LaMotte R. H. 1990. Tactile detection of slip: surface microgeometry and peripheral neural codes. J. Neurophysiol. 63, 1323–1332 - PubMed