. 2011 May;138(10):1925-34.
doi: 10.1242/dev.060020. Epub 2011 Apr 13.

Regulation of mammalian Notch signaling and embryonic development by the protein O-glucosyltransferase Rumi

Affiliations

Regulation of mammalian Notch signaling and embryonic development by the protein O-glucosyltransferase Rumi

Rodrigo Fernandez-Valdivia et al. Development. 2011 May.

Abstract

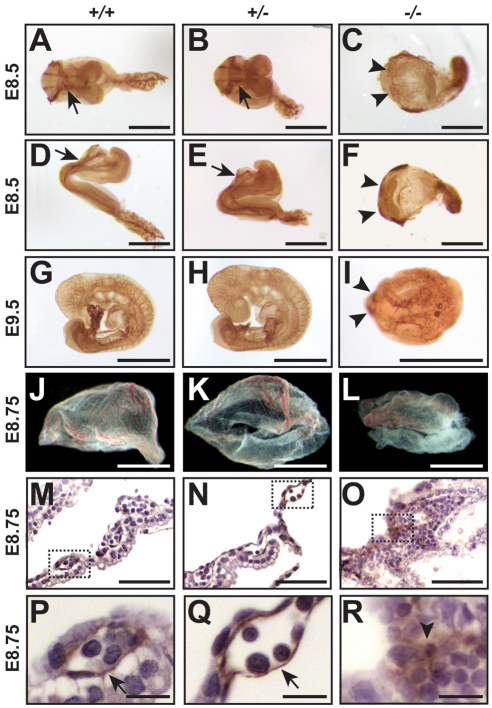
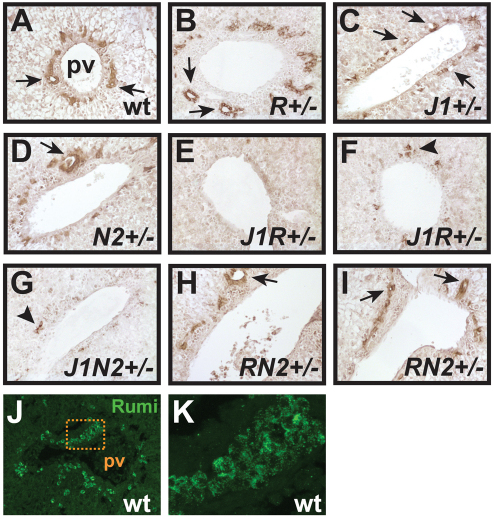
Protein O-glucosylation is a conserved post-translational modification that occurs on epidermal growth factor-like (EGF) repeats harboring the C(1)-X-S-X-P-C(2) consensus sequence. The Drosophila protein O-glucosyltransferase (Poglut) Rumi regulates Notch signaling, but the contribution of protein O-glucosylation to mammalian Notch signaling and embryonic development is not known. Here, we show that mouse Rumi encodes a Poglut, and that Rumi(-/-) mouse embryos die before embryonic day 9.5 with posterior axis truncation and severe defects in neural tube development, somitogenesis, cardiogenesis and vascular remodeling. Rumi knockdown in mouse cell lines results in cellular and molecular phenotypes of loss of Notch signaling without affecting Notch ligand binding. Biochemical, cell culture and cross-species transgenic experiments indicate that a decrease in Rumi levels results in reduced O-glucosylation of Notch EGF repeats, and that the enzymatic activity of Rumi is key to its regulatory role in the Notch pathway. Genetic interaction studies show that removing one copy of Rumi in a Jag1(+/-) (jagged 1) background results in severe bile duct morphogenesis defects. Altogether, our data indicate that addition of O-glucose to EGF repeats is essential for mouse embryonic development and Notch signaling, and that Jag1-induced signaling is sensitive to the gene dosage of the protein O-glucosyltransferase Rumi. Given that Rumi(-/-) embryos show more severe phenotypes compared to those displayed by other global regulators of canonical Notch signaling, Rumi is likely to have additional important targets during mammalian development.


Figures

Fig. 1.
Fig. 1.
Generation of a loss-of-function allele of mouse Rumi. (A) Structure of the mouse CAP10 proteins and their amino acid identity to Drosophila Rumi (dRumi). Blue boxes at N and C termini indicate the signal peptide and the ER-recycling signal, respectively. (B) The top panel shows the structure of the mouse Rumi locus. The vertical arrow shows the insertion site of the gene trap in intron 2 (ex, exon; SA, splice acceptor; pA, polyAdenylation signal; LTR, long terminal repeat; NEO, neomycin resistance gene probe). AvrII (A), BglII (B) and HindIII (H) sites are depicted by vertical lines. (C) qRT-PCR on RNA extracted from wild-type C57BL6 (C57) and the RumiβGeo/+ ES cell IST10323G11. Data are mean±s.e.m. (D) Multiplex PCR genotyping on genomic DNA with primers F1, R1 and R2 (5′ junction) and F1, R1 and F2 (3′ junction). (E) Southern blot analysis with the NEO probe to verify unique insertion of the 6.5 kb VICTR76 gene trap vector in the Rumi locus. Insertion of the gene trap vector in Rumi results in a unique 8.0 kb band upon digestion with AvrII (A). BglII (B) and HindIII (H) digestions each release a unique fragment of ~5.8 kb from the mutant Rumi allele. Note the comparable amounts of digested genomic DNA loaded for C57 and RumiβGeo/+ genotypes.
Fig. 2.
Fig. 2.
Rumi is the primary Poglut in the mouse. (A) qRT-PCR for Rumi, Kdelc1 and Kdelc2 on neonatal liver extracts from Rumi+/− and Rumi+/+. *P=0.003. Data are mean±s.e.m. The ranges of Ct values in the wild-type liver are 26.7-27.3 (Rumi), 28.2-29.0 (Kdelc1) and 27.0-28.1 (Kdelc2). (B,C) Sagittal section of E8.0 Rumi+/+ and Rumi−/− embryos stained with anti-Rumi antibody. Identical staining protocol and image acquisition and processing parameters were used for both genotypes. (D) Poglut and Pofut1 enzymatic assays on the neonatal liver extracts from Rumi+/− and Rumi+/+ mice. #P<0.002. Data are mean±s.e.m. (E) RT-PCR assays on neonatal mouse liver and cell lines derived from human hepatocellular carcinoma (HepG2), and from adult (NMuLi) and embryonic (BNL CL2) mouse liver. (F) Western blot analysis shows that Rumi is broadly expressed in the newborn and adult mouse tissues. cbl, cerebellum.
Fig. 3.
Fig. 3.
Loss of Rumi results in severe growth retardation and multiple abnormalities in mouse embryos. (A-L) Hematoxylin and Eosin staining of sagittal sections of E8.0 embryos. (A-F) At E8.0, Rumi−/− embryos display expansion of the dorsal anterior structures (arrow), absence of cardiac rudiments (arrowhead in A,B) and axis shortening/truncation. However, the allantois (brackets in A-C,M-O,R) is present in mutant embryos (C). Scale bars: 100 μm. D-F are higher magnification of the boxed areas in A-C. Whereas wild-type (D) and heterozygous (E) embryos display normal organization of the neural ectoderm (ec) and cephalic mesenchyme (me), Rumi−/− embryos (F) show a disorganized ectoderm (ec). A normal, bilayered amniotic membrane (a) is present in Rumi−/− embryos. Scale bars: 50 μm. (G-I) Sections from the anterior region of E8.0 embryos. Rumi−/− embryos (I) do form ectoderm (ec), mesoderm (m) and endoderm (en) layers, but the amount of mesodermal tissue seems to be reduced. As the amniotic cavity of Rumi−/− embryos is smaller than their wild-type and heterozygous counterparts, the amniotic membrane (a) is visible in the Rumi−/− embryo section (I). Scale bars: 50 μm. (J-L) Somites (dashed ovals) can be seen in sagittal sections of E8.0 wild-type (J) and heterozygous (K) embryos, but not in Rumi−/− embryos (L). Scale bars: 20 μm. (M-O) At E8.5, Rumi−/− embryos exhibit an unfolded neural plate (arrow in O) and posterior axis truncation, with an allantois directly connected to the anterior structures. Scale bars: 500 μm. (P-R) At E9.5, Rumi−/− embryos exhibit severe growth retardation and a neural tube that remains unfolded (arrow in R). Scale bars: 500 μm. (M-R) Lateral views.
Fig. 4.
Fig. 4.
Pecam1 staining reveals severe cardiovascular defects in Rumi mutant embryos. (A-I) Pecam1 staining of embryos and yolk sacs. (A-F) At E8.5, Rumi−/− embryos show cardia bifida, characterized by unfused cardiogenic plates (arrowheads) and absence of dorsal aorta. C and F are ventral and dorsal views of the same embryo, respectively. The heart is indicated by an arrow in A,B,D,E. Scale bars: 500 μm. (G-I) At E9.5, Rumi−/− embryos show no heart, with the cardiogenic plates still unfused (arrowheads) and severely abnormal vascularization. (I) Dorsal view. Scale bars: 1 mm. (J-L) At E8.75, Rumi−/− yolk sacs show abnormal vascular remodeling, characterized by the presence of several blood sinusoids. Scale bars: 1 mm. (M-R) Pecam1 staining of E8.75 yolk sacs marks the endothelial cells (arrows) in wild-type (P) and heterozygous (Q) animals. Note the diffused Pecam1 staining and absence of endothelial remodeling (arrowhead in R) in Rumi−/− animals. Scale bars: 50 μm. P-R are high magnification views of boxed areas in M-O. Scale bars: 10 μm.
Fig. 5.
Fig. 5.
Rumi knockdown promotes neurite extension in the Neuro2A neuroblastoma cell line. (A) qRT-PCR assays show a ~67% decrease in Rumi transcript levels (P=0.0006) and an 89.6% decrease in Hes1 levels (P=0.0016) in Neuro2A-30 cells compared with that in the Neuro2A-NT cells. (B) Poglut assays show a ~65% decrease in the enzymatic activity of Neuro2A-30 cells compared with Neuro2A-NT cells. Data in A,B are mean±s.e.m. (C,D) Differentiation assays at 4 hours on Neuro2A-NT and Neuro2A-30 cells. (E-I) Differentiation assays at 16-20 hours on Neuro2A-NT (E), Neuro2A-30 (F) and Neuro2A-30 cells transiently transfected with pTracer empty vector (G), pTracer-hRumi-FLAG (H) and pTracer-hRumi-G169E-FLAG (I). (J) Poglut assays indicate that hRumi-G169E-FLAG is enzymatically inactive. (K) Percentage of cells bearing neurites longer than one cell diameter after 16-20 hours of differentiation. Letters on the x-axis show the data for the corresponding panels. One-way ANOVA indicates that (E) is significantly different from all others except for (H) (P<0.0001). t-test indicates that the percentage of cells with neurites in Neuro2A-30 (F) is significantly different from Neuro2A-30-hRumi (H) (P=0.0008), but not from Neuro2A-30-G169E cells (I) (P=0.49). Data in J,K are mean±s.e.m.
Fig. 6.
Fig. 6.
Rumi knockdown results in decreased Notch signaling and reduced Notch O-glucosylation in C2C12 cells. (A) Poglut assays show a ~90% decrease in the enzymatic activity of C2C12-30 cells compared with C2C12-NT cells. Data are mean±s.e.m. (B-E) Rumi knockdown by shRNA-30 results in a dramatic decrease in the levels of O-glucosylation of Notch2 EGF repeats as shown by mass spectrometry. (B) The unglucosylated form of the 470EVNECQSNPCVNNGQCV486 peptide from EGF13 is present in the Rumi knockdown sample but not in the control. Underline indicates the O-glucosylated serine. (C) The O-glucosylated form of this peptide is more abundant in the control than in the Rumi knockdown sample. (D) The unglucosylated form of the 585DECYSSPCLN594 peptide from EGF16 is more abundant in the Rumi knockdown sample than in the control. Underline indicates the O-glucosylated serine. (E) The O-glucosylated form of this peptide is more abundant in the control than in the Rumi knockdown sample. See Fig. S4 in the supplementary material for MS and MS/MS spectra for B-E. (F) qRT-PCR for Hey1 and Hes1 on C2C12-30 and C2C12-NT cells. Data are mean±s.e.m. (G) Western blot using anti-Val1744 antibody (V1744). α-Tubulin (Tub) was used as loading control.
Fig. 7.
Fig. 7.
Notch ligand binding is not decreased upon Rumi knockdown. (A) Biotinylation assays on C2C12-NT and C2C12-30 cells show that Notch1 is present at the surface of both cell lines, as evidenced by the immunodetection of the N1ICD in the Avidin-bound samples. Data are representative from three independent experiments. β-Actin was used to indicate that intracellular proteins are not present in the Avidin-bound fraction, and also serves as a loading control for the input. TM-ICD indicates migration position of the transmembrane-intracellular fragment of Notch1. Asterisk indicates a non-specific C-terminal truncation of the TM-ICD, which is still exposed extracellularly and can be labeled by biotin. (B) Flow cytometry of Notch1 cell surface expression. Surface Notch1 was detected on both C2C12-NT and C2C12-30 cells (black dots to the right of the vertical line in the forward scatter plots). A modest yet significant difference in the mean fluorescence intensities (MFI) between C2C12-NT (MFI: 20580±340) and C2C12-30 (MFI: 16081±147) was observed (n=3, P=0.0003). Notch1 heterodimer removal by EDTA treatment resulted in negative immunolabeling. (C) Flow cytometry of ligand binding. Unlike the Fc negative control (a,d), both C2C12-NT and C2C12-30 cells strongly bind Jag1 (J1) and Delta-like1 (Dll1) (dark-gray histograms in b,c,e,f). No statistically significant difference was observed in their binding ability towards Jag1 (P=0.25) or Delta-like1 (P=0.92), as determined by comparison of the mean fluorescence intensities: C2C12-NT, J1 (MFI: 15819±435); C2C12-30, J1 (MFI: 17817±1423); C2C12-NT, Dll1 (MFI: 10402±491); C2C12-30, Dll1 (MFI: 10312±660). Incubation with EDTA/Ca++ (J1-EDTA/Ca++ and Dll1-EDTA/Ca++) results in leftward shift of the histograms (light-gray histograms in b,c,e,f), indicating the specificity of the binding assays. Flow cytometry profiles are representative of three independent experiments.
Fig. 8.
Fig. 8.
Protein O-glucosylation is not essential for the function of rat Dll1 in Drosophila. GFP-NLS marks MARCM clones of a wild-type chromosome (A) or the rumiΔ26 null allele (B) simultaneously expressing rat Dll1. (A-B′) Expression of rat Dll1 in rumi clones induces a strong expression of the Notch downstream target Cut in neighboring cells outside the clones (B,B′), similar to wild-type clones expressing rat Dll1 (A,A′). In wild-type cells, rat Dll1 does not show a cis-inhibitory effect on Drosophila Notch and is able to induce Cut expression in the clones (A,A′), as reported previously (Geffers et al., 2007). However, inside rumi clones, induction of Cut by rat Dll1 is abolished, most probably because of the impaired reception of Notch signaling in rumi clones. Asterisks in A and B indicate the endogenous wing margin, which expresses Cut independently of the rat Dll1 overexpression.
Fig. 9.
Fig. 9.
Genetic interaction between Rumi and Jag1 in the mouse. (A-I) DBA histochemical staining of biliary cells in P0 livers. Patent bile ducts (arrows) and biliary cells are found around the portal vein (pv) in wild-type (A), Rumi+/− (B), Jag1dDSL/+ (C), Notch2del3/+ (D) and Rumi+/−, Notch2del3/+ (H,I) animals. By contrast, Jag1dDSL/+, Rumi+/− livers show bile duct paucity, with either no biliary cells (E) or a few scattered ones (arrowhead in F), similar to Jag1dDSL/+, Notch2del3/+ livers (G). (J,K) Rumi immunofluorescent stainings of E18.5 liver sections. (K) A high magnification view of the area outlined in J showing the punctate cytoplasmic pattern of Rumi expression in a cluster of cells.

References

    1. Acar M., Jafar-Nejad H., Takeuchi H., Rajan A., Ibrani D., Rana N. A., Pan H., Haltiwanger R. S., Bellen H. J. (2008). Rumi is a CAP10 domain glycosyltransferase that modifies Notch and is required for Notch signaling. Cell 132, 247-258 - PMC - PubMed
    1. Bakker H., Oka T., Ashikov A., Yadav A., Berger M., Rana N. A., Bai X., Jigami Y., Haltiwanger R. S., Esko J. D., et al. (2009). Functional UDP-xylose transport across the endoplasmic reticulum/Golgi membrane in a Chinese hamster ovary cell mutant defective in UDP-xylose Synthase. J. Biol. Chem. 284, 2576-2583 - PMC - PubMed
    1. Bischof J., Maeda R. K., Hediger M., Karch F., Basler K. (2007). An optimized transgenesis system for Drosophila using germ-line-specific phiC31 integrases. Proc. Natl. Acad. Sci. USA 104, 3312-3317 - PMC - PubMed
    1. Bulman M. P., Kusumi K., Frayling T. M., McKeown C., Garrett C., Lander E. S., Krumlauf R., Hattersley A. T., Ellard S., Turnpenny P. D. (2000). Mutations in the human delta homologue, DLL3, cause axial skeletal defects in spondylocostal dysostosis. Nat. Genet. 24, 438-441 - PubMed
    1. Busch C., Hofmann F., Gerhard R., Aktories K. (2000). Involvement of a conserved tryptophan residue in the UDP-glucose binding of large clostridial cytotoxin glycosyltransferases. J. Biol. Chem. 275, 13228-13234 - PubMed

Publication types

MeSH terms