. 2011 Jun;85(12):5897-909.
doi: 10.1128/JVI.00428-11. Epub 2011 Apr 13.

Genome-wide analysis of the 5' and 3' ends of vaccinia virus early mRNAs delineates regulatory sequences of annotated and anomalous transcripts

Affiliations

Genome-wide analysis of the 5' and 3' ends of vaccinia virus early mRNAs delineates regulatory sequences of annotated and anomalous transcripts

Zhilong Yang et al. J Virol. 2011 Jun.

Abstract

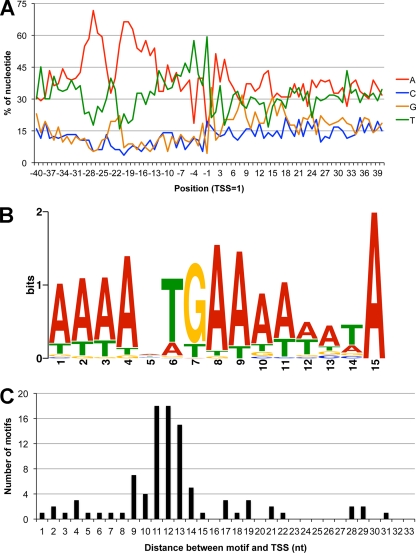
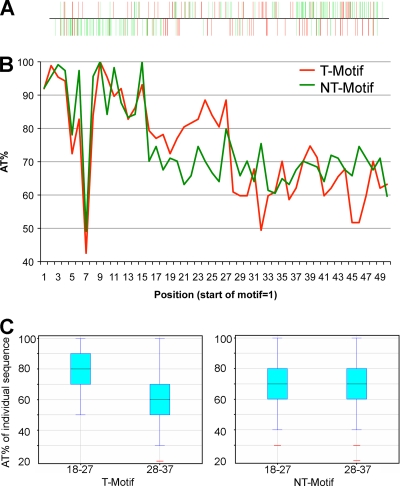
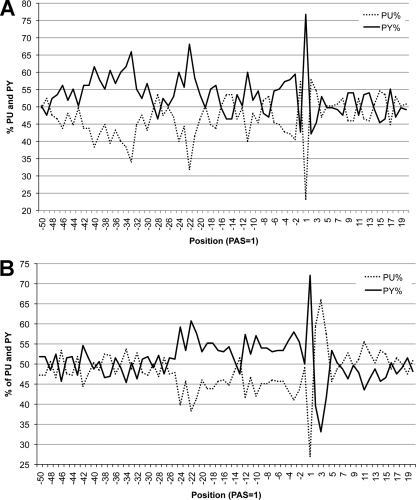
Poxviruses are large DNA viruses that encode a multisubunit RNA polymerase, stage-specific transcription factors, and enzymes that cap and polyadenylate mRNAs within the cytoplasm of infected animal cells. Genome-wide microarray and RNA-seq technologies have been used to profile the transcriptome of vaccinia virus (VACV), the prototype member of the family. Here, we adapted tag-based methods in conjunction with SOLiD and Illumina deep sequencing platforms to determine the precise 5' and 3' ends of VACV early mRNAs and map the putative transcription start sites (TSSs) and polyadenylation sites (PASs). Individual and clustered TSSs were found preceding 104 annotated open reading frames (ORFs), excluding pseudogenes. In the majority of cases, a 15-nucleotide consensus core motif was present upstream of the ORF. This motif, however, was also present at numerous other locations, indicating that it was insufficient for transcription initiation. Further analysis revealed a 10-nucleotide AT-rich spacer following functional core motifs that may facilitate DNA unwinding. Additional putative TSSs occurred in anomalous locations that may expand the functional repertoire of the VACV genome. However, many of the anomalous TSSs lacked an upstream core motif, raising the possibility that they arose by a processing mechanism as has been proposed for eukaryotic systems. Discrete and clustered PASs occurred about 40 nucleotides after an UUUUUNU termination signal. However, a large number of PASs were not preceded by this motif, suggesting alternative polyadenylation mechanisms. Pyrimidine-rich coding strand sequences were found immediately upstream of both types of PASs, signifying an additional feature of VACV 3'-end formation and polyadenylation.


Figures

Fig. 1.
Fig. 1.
Comparison of vaccinia virus (VACV) genome-wide transcription start sites (TSSs) determined at different times and by various CAGE (cap analysis of gene expression) methods. The sequences were from cells that were infected with virus for 1 h, 2, or 4 h in the presence of cycloheximide (1h/CHX, 2h/CHX, or 4h/CHX, respectively) or cells infected with virus for 2 h in the absence of cycloheximide (2h). The number of viral reads that mapped to each nucleotide were divided by the total number of reads for that sample and the ones with at least 0.01% of the total were aligned with the top and bottom DNA strands. The genome nucleotide numbers are below each strand in kilobases (kb).
Fig. 2.
Fig. 2.
TSS patterns and initiator nucleotide usage. (A) TSS patterns. The vertical bars indicate the percentages of counts relative to the highest in the cluster at each position in a 64-nt window. The number in the top left corner of each panel indicates the genome nucleotide location of the TSS with the highest counts in the cluster. Examples of single-peak (SP), multiple-peak (MP) and broad-region (BR) patterns are shown. (B) Initiator nucleotide usage. The frequencies of A, C, G, and T at TSSs were determined from the highest peak in each cluster. The SOLiD oCAGE data set was used.
Fig. 3.
Fig. 3.
VACV genome-wide TSS map. RNA was isolated at 2 h postinfection in the presence of CHX and processed by the SOLiD oCAGE method. The TSS counts mapping to the top and bottom DNA strands are displayed above and below the black horizontal line, respectively. The highest counts are off the scale for display purposes. The red and black arrowheads and arrows indicate the direction of transcription of early and postreplication (PR) ORFs, respectively, as described previously (61). The genome nucleotide numbers (in kilobases) are shown below each panel.
Fig. 4.
Fig. 4.
Early promoter motif. (A) Plot of A, C, G, and T frequencies at each position from 40 nt upstream and 40 nt downstream of all annotated VACV TSSs from SOLiD oCAGE samples. (B) The core promoter motif generated from 50-nt sequences upstream of the annotated VACV TSSs by the MEME program with the assumption that there is zero or one motif in each sequence. (C) The distances after position 15 of the motif to the transcription site were plotted. In each panel, the nucleotide (nt) at the highest peak in a cluster was used as the TSS for the calculations.
Fig. 5.
Fig. 5.
AT frequency following the core motif correlates with transcription. (A) Distribution of the 318 core motifs on the VACV genome (P < 0.0001 by the FIMO program). The motifs with no or only one TSS count were colored red, and the ones with more than one count were colored green. (B) Incidence of A and T at each position 50 nt downstream of the T-motif and NT-motif. (C) Box-and-whisker plots of AT frequency of the 10 nt from positions 18 to 27 and positions 28 to 37 of individual T-motifs and NT-motifs, respectively. In the box-and-whisker plots, the first and third quartiles are indicated by the bottom and top of the box, respectively. The median is indicated by the line in the middle of the box. The “whiskers” extend to the farthest points that are within 1.5 times the interquartile range.
Fig. 6.
Fig. 6.
VACV genome-wide polyadenylation site (PAS) map. RNA was isolated at 2 h after VACV infection in the absence of CHX and processed to determine PASs as outlined in Fig. S3 in the supplemental material. The counts mapping to individual nucleotides in the top and bottom DNA strands are displayed above and below the black horizontal line, respectively. PASs that are preceded within 100 nt by T5NT are colored red, and those without T5NT are black. The red and black arrows indicate the directions of transcription of the early and postreplicative ORFs, respectively. The genome nucleotide numbers (in kilobases) are shown below each panel.
Fig. 7.
Fig. 7.
Relation of PASs to upstream sequences. (A) Distance between T5NT and the nearest downstream PAS. (B) Examples of discrete and cluster PASs. In the top two panels, the T5NT sequences are marked by black horizontal lines. The black vertical bars indicate the PASs. No T5NT sequences were present within 100 nt upstream in the bottom two panels. The numbers indicate the start and end nucleotide of each displayed sequence.
Fig. 8.
Fig. 8.
Pyrimidine (PY) and purine (PU) frequencies surrounding PASs. (A) Frequencies for PASs preceded within 100 nt by T5NT; (B) frequencies for PASs not preceded by T5NT.
Fig. 9.
Fig. 9.
Features associated with TSSs and PASs. The TSS is indicated by +1. The most common nucleotide at each position of the 15-nt core promoter motif is indicated. N means that there was no predominant nucleotide. The core motif associated with a TSS is followed by an AT-rich spacer, which distinguishes it from silent core motifs in the genome. The untranslated RNA leader sequence (UTR) preceding the ATG translation initiation codon varies greatly in length with a median size of 21 nt. The RNA U5NU motif (T5NT in DNA) can occur before or after the stop codon and signals transcription termination approximately 40 nt downstream. RNAs with and without the U5NU sequence frequently have a pyrimidine-rich sequence near the PAS.

References

    1. Ahn B.-Y., Gershon P. D., Moss B. 1994. RNA polymerase-associated protein RAP94 confers promoter specificity for initiating transcription of vaccinia virus early stage genes. J. Biol. Chem. 269:7552–7557 - PubMed
    1. Ahn B.-Y., Jones E. V., Moss B. 1990. Identification of the vaccinia virus gene encoding an 18-kilodalton subunit of RNA polymerase and demonstration of a 5′ poly(A) leader on its early transcript. J. Virol. 64:3019–3024 - PMC - PubMed
    1. Assarsson E., et al. 2008. Kinetic analysis of a complete poxvirus transcriptome reveals an immediate-early class of genes. Proc. Natl. Acad. Sci. U. S. A. 105:2140–2145 - PMC - PubMed
    1. Bailey T. L., Elkan C. 1994. Fitting a mixture model by expectation maximization to discover motifs in biopolymers. Proc. Int. Conf. Intell. Syst. Mol. Biol. 2:28–36 - PubMed
    1. Bailey T. L., Gribskov M. 1998. Combining evidence using p-values: application to sequence homology searches. Bioinformatics 14:48–54 - PubMed

Publication types

MeSH terms

LinkOut - more resources