. 2011 Jul;4(7):1135-44.
doi: 10.1158/1940-6207.CAPR-10-0374. Epub 2011 Apr 13.

Accurate reconstruction of the temporal order of mutations in neoplastic progression

Affiliations

Accurate reconstruction of the temporal order of mutations in neoplastic progression

Kathleen Sprouffske et al. Cancer Prev Res (Phila). 2011 Jul.

Abstract

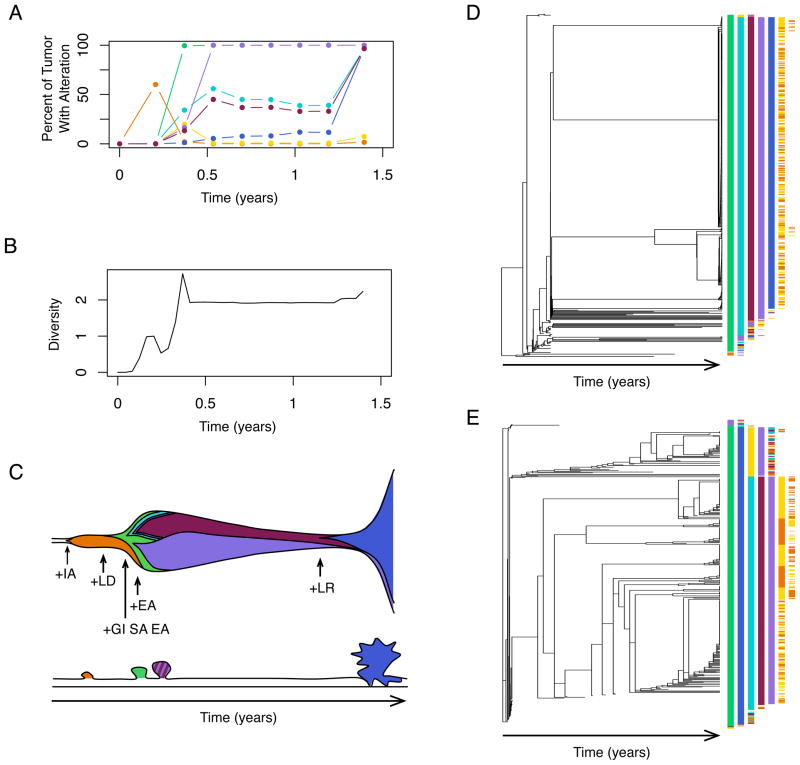
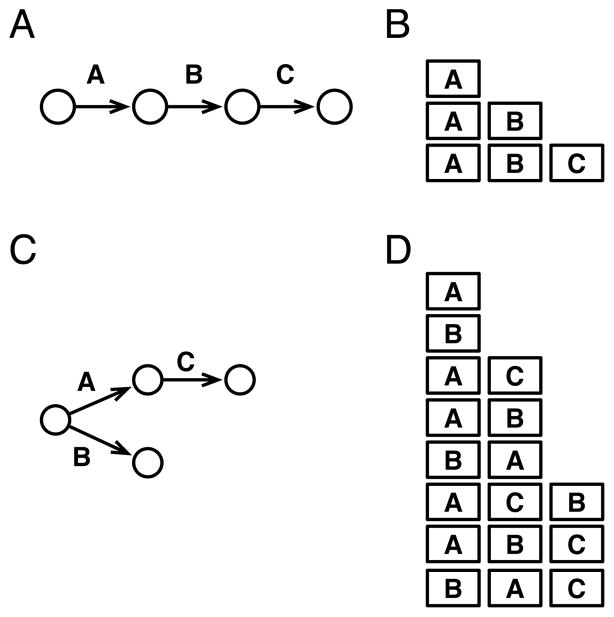
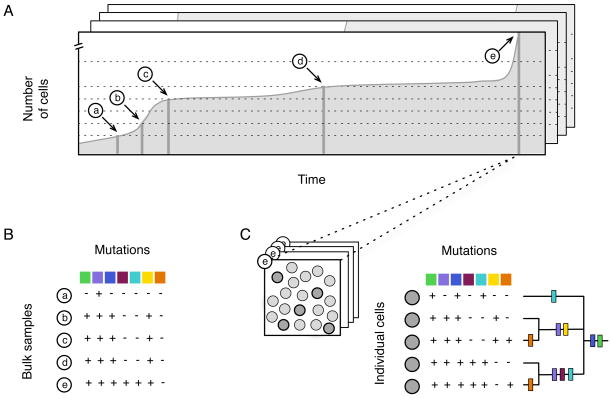
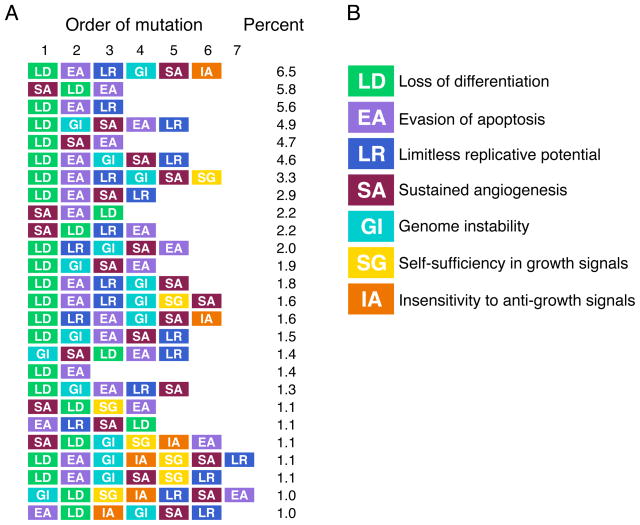
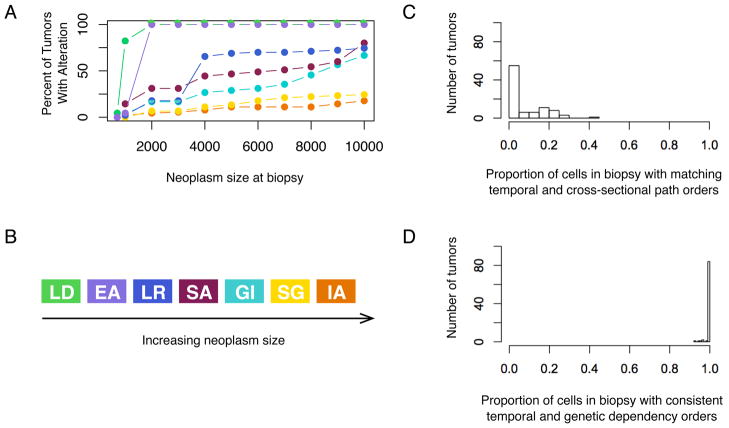
The canonical route from normal tissue to cancer occurs through sequential acquisition of somatic mutations. Many studies have constructed a linear genetic model for tumorigenesis using the genetic alterations associated with samples at different stages of neoplastic progression from cross-sectional data. The common interpretation of these models is that they reflect the temporal order within any given tumor. Linear genetic methods implicitly neglect genetic heterogeneity within a neoplasm; each neoplasm is assumed to consist of one dominant clone. We modeled neoplastic progression of colorectal cancer using an agent-based model of a colon crypt and found clonal heterogeneity within our simulated neoplasms, as observed in vivo. Just 7.3% of cells within neoplasms acquired mutations in the same order as the linear model. In 41% of the simulated neoplasms, no cells acquired mutations in the same order as the linear model. We obtained similarly poor results when comparing the temporal order with oncogenetic tree models inferred from cross-sectional data. However, when we reconstructed the cell lineage of mutations within a neoplasm using several biopsies, we found that 99.7% cells within neoplasms acquired their mutations in an order consistent with the cell lineage mutational order. Thus, we find that using cross-sectional data to infer mutational order is misleading, whereas phylogenetic methods based on sampling intratumor heterogeneity accurately reconstructs the evolutionary history of tumors. In addition, we find evidence that disruption of differentiation is likely the first lesion in progression for most cancers and should be one of the few regularities of neoplastic progression across cancers.


Figures

Fig. 1
Fig. 1
Illustration of path and oncogenetic tree mutational models inferred from cross-sectional data, and all possible temporal orders of clonal mutations that are consistent with the models. Each arrow between circles represents the acquisition of a new mutation in models inferred from cross-sectional data, and squares represent the accumulation of a new mutation in a clone during the evolution of a tumor. (A) The path model of carcinogenesis implies a linear order of sequential mutations from wild-type through A, B, and C, in order. (B) These are the temporal mutations that a cell lineage, or clone of cells, could acquire during evolution and still be consistent with the cross-sectional path model in A. All other sequences of mutations are inconsistent with the cross-sectional path model (e.g., B, C, AC, and BAC are inconsistent). (C) The oncogenetic tree model of carcinogenesis implies that all tumors begin as wild-type, and can next acquire either mutation A or B. Additionally, C can only occur at any point after mutation A has occurred. (D) All temporal mutations acquired by a clone that are consistent with the cross-sectional oncogenetic tree in C. Note that the order A, B, C is consistent because C occurs after A.
Fig. 2
Fig. 2
Explanation of sampling strategies using a representative simulation. Each simulation represents a single tumor and the order of mutations was inferred from the set of all tumors, using two alternative strategies. (A) The number of cells in this simulation increased over time until it became large enough to trigger detection of cancer (labeled as e). The cross-sectional path model was derived from sampling all tumors based on their size. Most cross-sectional studies take one biopsy per patient and categorize the tumors by size (and/or grade). To simulate this, we took biopsies of each tumor at pre-specified sizes (dashed lines) and then assayed the majority genotype for the biopsy (B). Data from each size class was summarized across all simulations to measure the frequency of mutations for each size class (see Fig. 4A). (C) The alternative to cross-sectional sampling is to reconstruct the cell lineages for each tumor. This was done using 5 randomly selected cells from the final timepoint e. During simulations, the cell lineages were recorded, since exact lineage relationships could be derived from detailed genetic data for each cell. The phenotypic effect of each mutation is represented by a different color, defined in Fig. 3B.
Fig. 3
Fig. 3
The most common temporal paths found in clones that survived to cancer. (A) Each of these common temporal paths comprise on average at least 1% of the neoplasm, and together these 26 paths account for 64% of the cells found in all the cancerous neoplasms. (B) Each mutation is represented by a different color: loss of differentiation (LD) is green, evasion of apoptosis (EA) is purple, limitless replicative potential (LR) is dark blue, sustained angiogenesis (SA) is red, genomic instability (GI) is light blue, self-sufficiency in growth signals (SG) is yellow, and insensitivity to anti-growth signals (IA) is orange.
Fig. 4
Fig. 4
The temporal order of mutations in cancer clones rarely matches the path order from cross-sectional data, though the temporal order of clones matches the order inferred from the genetic-dependency analysis from intra-tumor data. (A) Plotting the percent of tumors with a given mutation at increasing neoplasm sizes can be used to infer (B) the cross-sectional path model of mutations. (C) However, the proportion of cells within any given simulated neoplasm whose temporal order is consistent with the cross-sectional path order tends to be low (mean = 7.3%, s.e.m. = 1.0%, n = 90). (D) The proportion of cells within any given simulation whose temporal order is consistent with the inferred order from the genetic-dependency analysis is high (mean = 99.7%, s.e.m. = 0.1%, n = 90). Each mutation is represented by a different color as given in Fig. 3B.
Fig. 5
Fig. 5
Details of a single simulation as it progresses to cancer. (A) Plot of the percent of cells within this neoplasm that contain a given mutation over time. Note that the IA reaches detection early in progression and regresses. (B) Plot of the Shannon index for diversity, or information entropy, over time for the simulation. (C) The top panel shows the clones, their mutational states, and their rough population sizes over time. The height is proportional to the population size of the neoplasm, and new mutations are indicated with an arrow. The bottom panel shows the type of neoplasm that would be identified at various points during progression from normal tissue to cancer, beginning with polyps and ending with cancer. (D) The genealogy, or cell lineage, for all of the clones that arose during the evolution of the neoplasm shows that a single evolutionary run doesn’t have a single evolutionary path. The temporal order of phenotypes is given at the tips of the genealogy. Because we are modeling phenotypes, the same set of phenotypic mutations can occur in clones that are unique by descent. Each new mutation for a phenotype is a new mutation in a gene or pathway conferring the phenotype. Thus, we have what looks like convergent evolution - there is phenotypic homogeneity, but it arose through different genetic alterations. Under these parameters, independent acquisition of hallmarks in different clones is common and leads to clonal interference and the suppression of clonal expansion for any one clone. Note that the most commonly-observed phenotypic order does not correspond to the cross-sectional path order given in Fig. 3B. (E) The genealogy, or cell lineage, for all of the clones that arose during the evolution of the neoplasm pictured in Fig. 2. Both neoplasms pictured here have relatively high genetic heterogeneity at cancer detection. As occurs here, genetic heterogeneity may lead to phenotypic homogeneity. Each mutation is represented by a different color as given in Fig. 3B.

References

    1. Nowell PC. The clonal evolution of tumor cell populations. Science. 1976;194:23–28. - PubMed
    1. Sniegowski PD, Gerrish PJ. Beneficial mutations and the dynamics of adaptation in asexual populations. Philos Trans R Soc Lond, B, Biol Sci. 2010;365:1255–63. - PMC - PubMed
    1. Sgroi DC. Preinvasive breast cancer. Annu Rev Pathol. 2010;5:193–221. - PMC - PubMed
    1. Wistuba II, Mao L, Gazdar AF. Smoking molecular damage in bronchial epithelium. Oncogene. 2002;21:7298–306. - PubMed
    1. Balaban GB, Herlyn M, Clark WH, Nowell PC. Karyotypic evolution in human malignant melanoma. Cancer Genet Cytogenet. 1986;19:113–22. - PubMed

Publication types