. 2011 Jun;156(2):913-24.
doi: 10.1104/pp.111.173088. Epub 2011 Apr 13.

High-resolution secondary ion mass spectrometry reveals the contrasting subcellular distribution of arsenic and silicon in rice roots

Affiliations

High-resolution secondary ion mass spectrometry reveals the contrasting subcellular distribution of arsenic and silicon in rice roots

Katie L Moore et al. Plant Physiol. 2011 Jun.

Abstract

Rice (Oryza sativa) takes up arsenite mainly through the silicic acid transport pathway. Understanding the uptake and sequestration of arsenic (As) into the rice plant is important for developing strategies to reduce As concentration in rice grain. In this study, the cellular and subcellular distributions of As and silicon (Si) in rice roots were investigated using high-pressure freezing, high-resolution secondary ion mass spectrometry, and transmission electron microscopy. Rice plants, both the lsi2 mutant lacking the Si/arsenite efflux transporter Lsi2 and its wild-type cultivar, with or without an iron plaque, were treated with arsenate or arsenite. The formation of iron plaque on the root surface resulted in strong accumulation of As and phosphorous on the epidermis. The lsi2 mutant showed stronger As accumulation in the endodermal vacuoles, where the Lsi2 transporter is located in the plasma membranes, than the wild-type line. As also accumulated in the vacuoles of some xylem parenchyma cells and in some pericycle cells, particularly in the wild-type mature root zone. Vacuolar accumulation of As is associated with sulfur, suggesting that As may be stored as arsenite-phytochelatin complexes. Si was localized in the cell walls of the endodermal cells with little apparent effect of the Lsi2 mutation on its distribution. This study reveals the vacuolar sequestration of As in rice roots and contrasting patterns of As and Si subcellular localization, despite both being transported across the plasma membranes by the same transporters.


Figures

Figure 1.
Figure 1.
NanoSIMS image of the outer edge of an lsi2 mutant near the root tip with Fe plaque and treated with silicic acid and arsenate, showing the outer four cell layers of the root with strong epidermal As colocalization with the Fe plaque (represented by the 56Fe16O image). Ep, Epidermis; Ex, exodermis; Sc, sclerenchyma; SE, secondary electron image. [See online article for color version of this figure.]
Figure 2.
Figure 2.
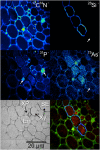
NanoSIMS image of the stele region of an lsi2 mutant from near the root tip treated with arsenate, showing As accumulation in the vacuoles of the endodermis with Si localized around the same cells. The color merge image shows the relative locations of 75As (red), 12C14N (green), and 28Si (blue). The white arrows on the 31P image indicate the positions of nuclei, and the white arrows on the 28Si75As images indicate cells with no Si or As accumulation. En, Endodermis; SE, secondary electron image; XP, xylem parenchyma; Xy, xylem. [See online article for color version of this figure.]
Figure 3.
Figure 3.
NanoSIMS image of the stele region from a wild-type root near the root tip treated with arsenate, showing no As accumulation in the vacuoles of the endodermis. Si is localized around the endodermal cells with the same distribution pattern as in the lsi2 mutant (Fig. 2). En, Endodermis; SE, secondary electron image; Xy, xylem. [See online article for color version of this figure.]
Figure 4.
Figure 4.
NanoSIMS image of the stele region of an lsi2 mutant from near the root tip treated with silicic acid and arsenate, showing As accumulation in the vacuoles of the pericycle. No localization of Si was detected in this region. En, Endodermis; Pc, pericycle; SE, secondary electron image; XP, xylem parenchyma; Xy, xylem. The red arrows on the 12C14N image indicate where there has been HPF damage, resulting in a split across the cells subsequently filled with resin. [See online article for color version of this figure.]
Figure 5.
Figure 5.
NanoSIMS image of the stele region of the mature zone of a wild-type root treated with silicic acid and arsenite, showing some As accumulation in the endodermis and very strong As accumulation in the vacuoles of the pericycle colocalized with a strong S signal. The proximal side of the endodermal cells is noticeably thicker, corresponding with a higher Si concentration. En, Endodermis; Pc, pericycle; SE, secondary electron image; Xy, xylem. [See online article for color version of this figure.]
Figure 6.
Figure 6.
NanoSIMS images of 75As showing As accumulation in xylem parenchyma cells near the root tip, as indicated by the white circles. This accumulation is more common in the lsi2 mutants; however, it has also been observed in one wild-type cell (top right). Only the image in the top middle is from a sample treated with a ferrous solution. All images are 50 μm × 50 μm. [See online article for color version of this figure.]
Figure 7.
Figure 7.
Combined TEM and nanoSIMS analysis indicating that Si is localized to some but not all endodermal cell walls. An overview of two endodermal cells is shown in A, with the red squares indicating the locations of the higher magnification TEM images shown in B and C. White arrows indicate the positions of the dark Si-rich features. The nanoSIMS image in D is taken from an adjacent section, and the relative positions of the 12C14N28Si signals are shown in green and blue, respectively. The red arrow in D indicates the position of the line scan in E, showing that the 12C14N28Si signals originate from different locations in the cell wall. [See online article for color version of this figure.]
Figure 8.
Figure 8.
ICP-MS and nanoSIMS data for each treatment. ICP-MS data show the total concentration of As in the roots. The nanoSIMS data show the summed (edge and stele) 75As/12C14N ratio and have been scaled to the wild-type (WT) + Fe As (III) ICP-MS data for comparison. Error bars on the nanoSIMS data represent the summed sd values from the edge and stele regions. ICP-MS analysis was performed on one replicate of the root samples.

Similar articles

Cited by

References

    1. Ali M, Badruzzaman A, Jalil M, Hossain M, Ahmed M, Al Masud A, Kamruzzaman M, Azizur Rahman M. (2003) Fate of arsenic extracted with groundwater. Ahmed M, ed, Fate of Arsenic in the Environment. International Training Network, Dhaka, Bangladesh, pp 7–20
    1. Armstrong W. (1967) Oxidising activity of roots in waterlogged soils. Physiol Plant 20: 920–926
    1. Bleeker PM, Hakvoort HWJ, Bliek M, Souer E, Schat H. (2006) Enhanced arsenate reduction by a CDC25-like tyrosine phosphatase explains increased phytochelatin accumulation in arsenate-tolerant Holcus lanatus. Plant J 45: 917–929 - PubMed
    1. Bogdan K, Schenk MK. (2008) Arsenic in rice (Oryza sativa L.) related to dynamics of arsenic and silicic acid in paddy soils. Environ Sci Technol 42: 7885–7890 - PubMed
    1. Brammer H, Ravenscroft P. (2009) Arsenic in groundwater: a threat to sustainable agriculture in South and South-east Asia. Environ Int 35: 647–654 - PubMed

Publication types