. 2011 Apr 13;31(15):5562-73.
doi: 10.1523/JNEUROSCI.6066-10.2011.

Reconsolidation or extinction: transcription factor switch in the determination of memory course after retrieval

Affiliations

Reconsolidation or extinction: transcription factor switch in the determination of memory course after retrieval

Verónica de la Fuente et al. J Neurosci. .

Abstract

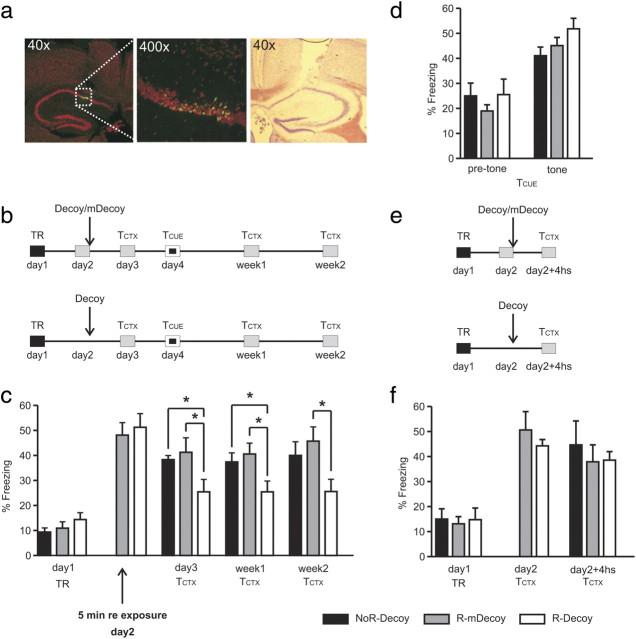
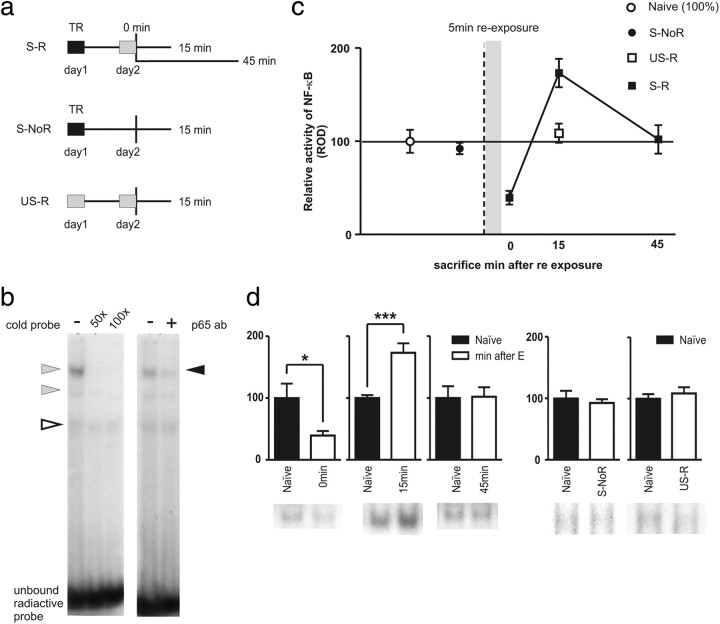
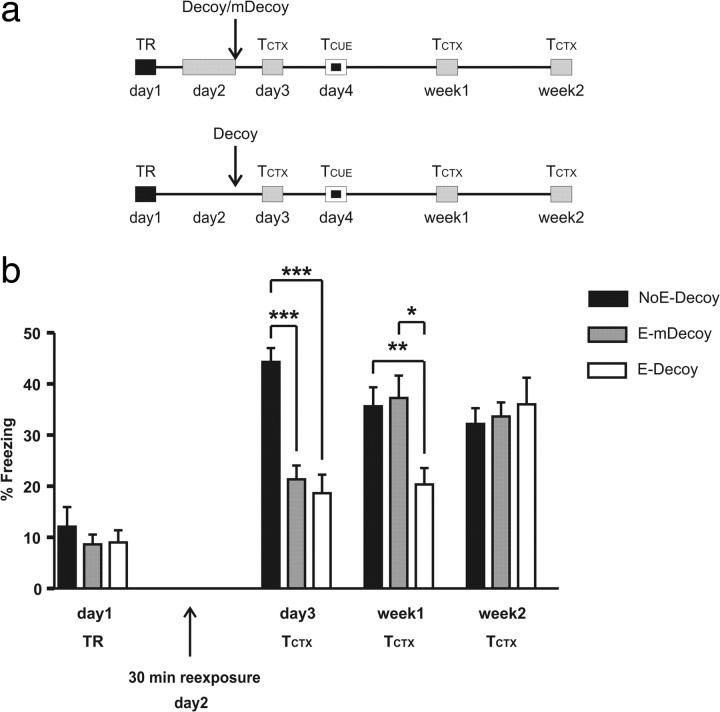
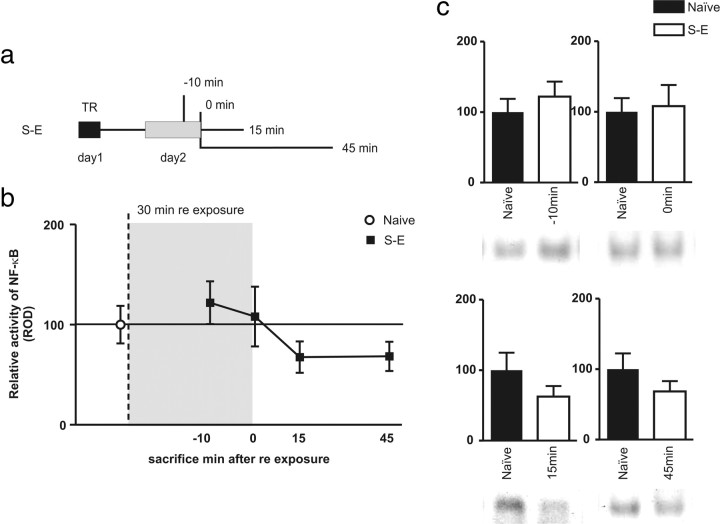
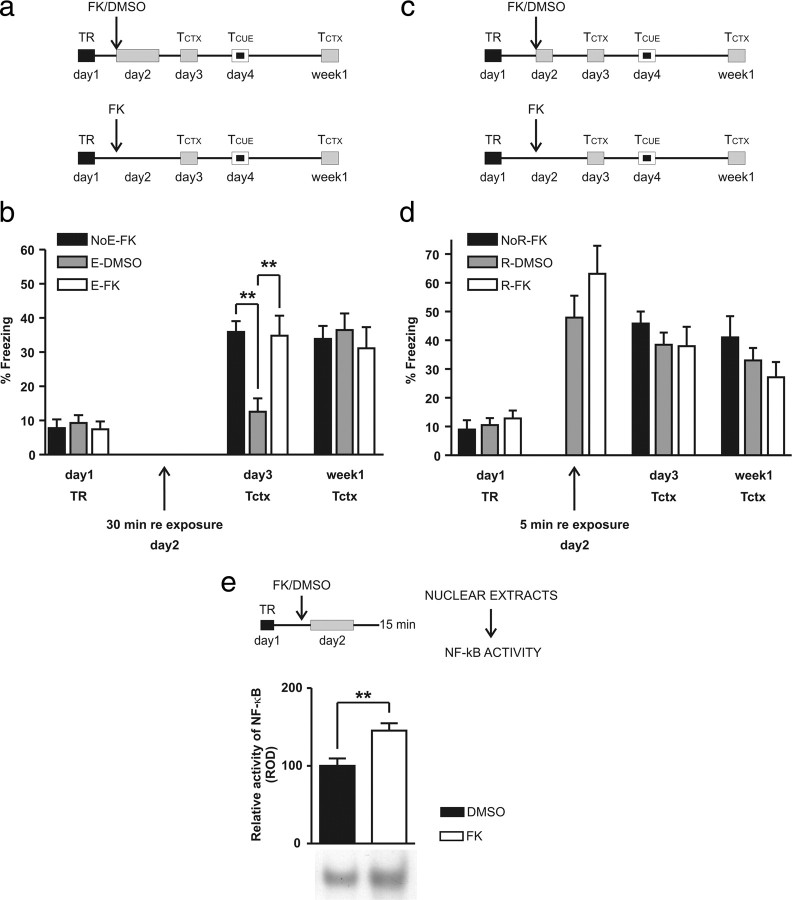
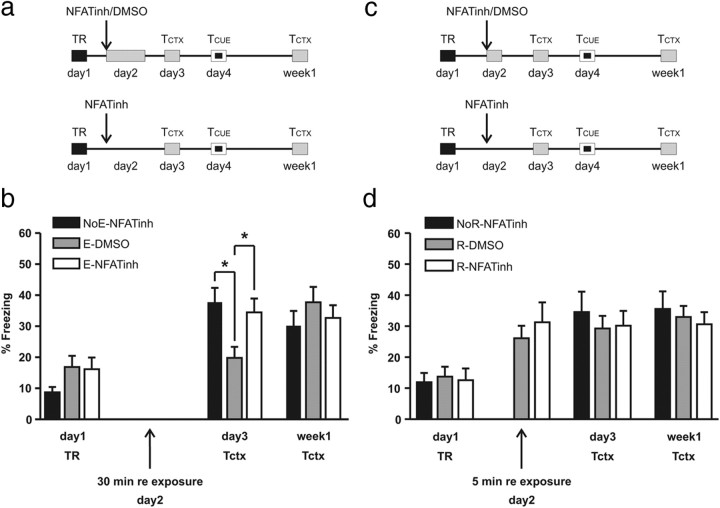
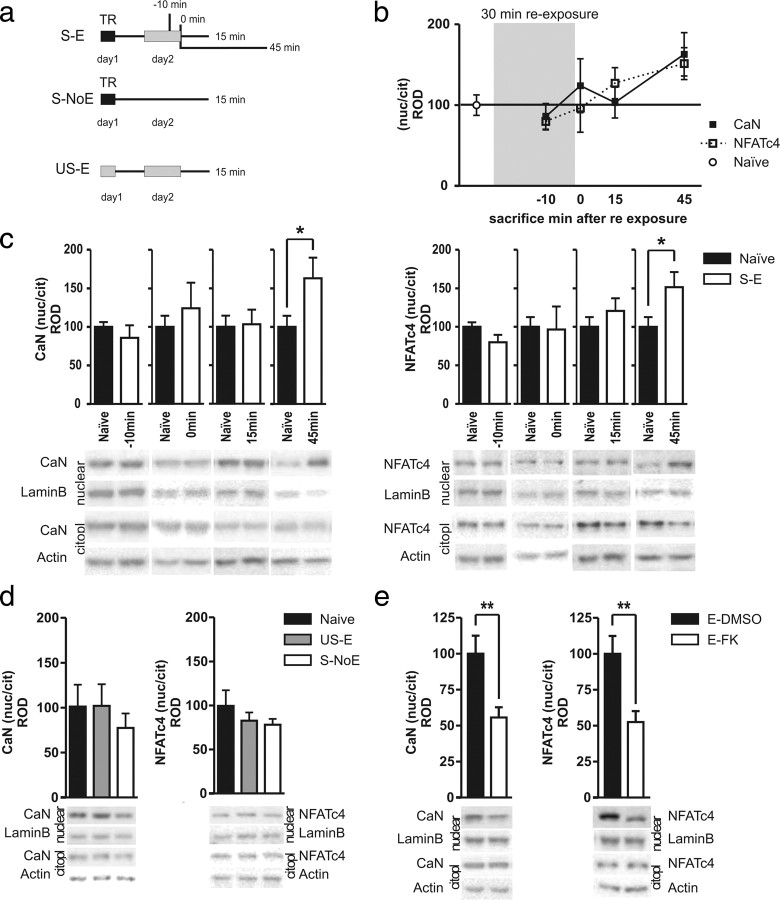
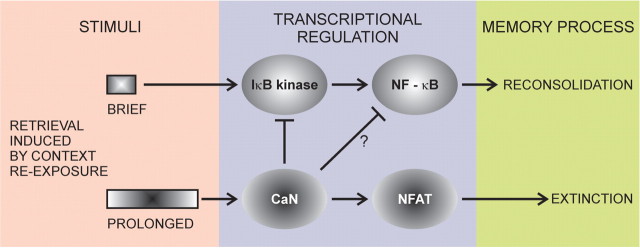
In fear conditioning, aversive stimuli are readily associated with contextual features. A brief reexposure to the training context causes fear memory reconsolidation, whereas a prolonged reexposure induces memory extinction. The regulation of hippocampal gene expression plays a key role in contextual memory consolidation and reconsolidation. However, the mechanisms that determine whether memory will reconsolidate or extinguish are not known. Here, we demonstrate opposing roles for two evolutionarily related transcription factors in the mouse hippocampus. We found that nuclear factor-κB (NF-κB) is required for fear memory reconsolidation. Conversely, calcineurin phosphatase inhibited NF-κB and induced nuclear factor of activated T-cells (NFAT) nuclear translocation in the transition between reconsolidation and extinction. Accordingly, the hippocampal inhibition of both calcineurin and NFAT independently impaired memory extinction, whereas inhibition of NF-κB enhanced memory extinction. These findings represent the first insight into the molecular mechanisms that determine memory reprocessing after retrieval, supporting a transcriptional switch that directs memory toward reconsolidation or extinction. The precise molecular characterization of postretrieval processes has potential importance to the development of therapeutic strategies for fear memory disorders.


Figures

Figure 1.
Figure 1.
NF-κB inhibition in the hippocampus impairs contextual fear memory reconsolidation. Data are expressed as mean ± SEM of freezing response. a, Confocal micrographs show distribution of fluoresceinated Decoy (green) 5 min after hippocampal injection, contrasted with propidium iodide. Concentration was the same of the nonfluoresceinated Decoy used in pharmacological experiments. An image showing an example of cannula position is also shown (cresyl violet stained). b, Design of the experiment shown in c. All groups were trained at day 1; at day 2, animals were either reexposed for 5 min to the training context and injected with mDecoy (R-mDecoy) (n = 9) or with Decoy (R-Decoy) (n = 8), or were non-reexposed and injected with Decoy (NoR-Decoy) (n = 8). TR, Training session; Tctx, contextual test; Tcue, cued test. c, Effect of hippocampal NF-κB inhibition in contextual memory reconsolidation. d, Effect of hippocampal NF-κB inhibition in cued memory. Groups and animals are as in b. e, Design of the experiment shown in f. Animals were trained, reexposed or non-reexposed, and injected either with mDecoy or Decoy as in b, but the contextual test was performed 4 h after reexposure (24 h plus 4 h from TR in the case of the non-reexposed group). f, Effect of NF-κB inhibition in contextual STRM; NoR-Decoy, n = 6; R-mDecoy, n = 8; R-Decoy, n = 7. *p < 0.05, one-way ANOVA comparing mean values of freezing of the three groups each day, followed by Newman–Keuls post hoc test; in case of cued memory, two-way ANOVA followed by Bonferroni's post hoc test was performed.
Figure 2.
Figure 2.
Temporal course of NF-κB activity after 5 min reconsolidation session, estimated by EMSA. Data are expressed as mean ROD values ± SEM. a, Design of the experiment. Trained animals were killed immediately (0 min time point), 15 or 45 min after 5 min reconsolidation session (S-R). Three control groups were performed: naive group, S-NoR group (trained animals but not reexposed to the context on day 2), and US-R group (animals were placed in the training chamber on day 1, received the tones but not the shocks, and were reexposed 5 min on day 2). b, Left, Representative EMSA. Three bands can be observed; competitions with 50 or 100× cold probe determine specific bands. Specific (gray arrowhead) and unspecific bands (white arrowhead) are shown. Right, Supershift with p65 antibody, which reduced the intensity of the higher band (black arrowhead, the one quantified in the experiments), corresponding to p65/p50 complex. c, Schematic graph with NF-κB activity from all groups together is shown, n = 9–10 in each group. NF-κB activity was estimated by densitometric analysis (ROD) of the p65/p50 band, obtained with hippocampal nuclear extracts from animals of the different groups by gel shift. Each time point was compared with its respective naive. d, Graphs comparing NF-κB activity from each S-R, S-NoR, and US-R groups with their respective naive are shown. With these values, the schematic graph seen in c was performed. Representative p65/p50 EMSA bands are shown. *p < 0.05; ***p < 0.001; Student's t test.
Figure 3.
Figure 3.
NF-κB inhibition in the hippocampus enhances contextual fear memory extinction. Data are expressed as mean ± SEM of freezing response. a, Design of the experiment. All groups were trained at day 1; at day 2, animals were either reexposed for 30 min to the training context and injected with m-Decoy (E-mDecoy) (n = 11) or with Decoy (E-Decoy) (n = 9), or were non-reexposed and injected with Decoy (NoE-Decoy) (n = 8). TR, Training session; Tctx, contextual test; Tcue, cued test. b, Effect of NF-κB inhibition in contextual memory extinction. *p < 0.05; **p < 0.01; ***p < 0.001; one-way ANOVA comparing mean values of freezing of the three groups each day, followed by Newman–Keuls post hoc test.
Figure 4.
Figure 4.
Temporal course of NF-κB activity in extinction, estimated by EMSA. Data are expressed as mean ROD values ± SEM. a, Design of the experiment. Animals were killed immediately (0 min time point), 15 or 45 min after 30 min extinction session (S-E). A point of −10 min was also performed, in which animals were killed immediately after 20 min extinction session. Naive group was used for basal activity estimation. b, Schematic graph with NF-κB activity from all groups together is shown. n = 9–10 in each group. NF-κB activity was estimated by densitometric analysis (ROD) of the p65/p50 band, obtained with hippocampal nuclear extracts from animals of the different groups by gel shift. c, Graphs comparing NF-κB activity from each S-E group with their respective naive are shown. With these values, the schematic graph seen in b was performed. Representative p65/p50 EMSA bands are shown; Student's t test.
Figure 5.
Figure 5.
CaN inhibition in the hippocampus impairs extinction but not reconsolidation. a–d, Data are expressed as mean ± SEM of freezing response. a, Design of the extinction experiment shown in b. All groups were trained at day 1; at day 2, animals were either reexposed for 30 min to the training context and injected with DMSO (E-DMSO) (n = 8) or with FK (E-FK) (n = 8), or were non-reexposed and injected with FK (NoE-FK) (n = 8). TR, Training session; Tctx, contextual test; Tcue, cued test. b, Effect of CaN inhibition in contextual memory extinction. c, Design of the reconsolidation experiment shown in d. Groups are as in a, but for a 5 min reexposure: non-reexposed animals injected with FK (NoR-FK) (n = 8), reexposed injected with vehicle (R-DMSO) (n = 12), and reexposed injected with FK (R-FK) (n = 10). d, Effect of CaN inhibition in contextual memory reconsolidation. a–d, **p < 0.01; one-way ANOVA comparing mean values of freezing of the three groups each day, followed by Newman–Keuls post hoc test. e, Effect of CaN inhibition on NF-κB activity. Left, On day 2, trained animals were injected either with FK or with DMSO and reexposed for 30 min to the TR context. Fifteen minutes after extinction session, animals were killed and NF-κB activity was estimated by densitometric analysis (ROD) of the p65/p50 band (EMSA). The graph shows mean ROD values ± SEM. Representative bands are shown. **p < 0.01, Student's t test.
Figure 6.
Figure 6.
NFAT inhibition in the hippocampus impairs extinction but not reconsolidation. a–d, Data are expressed as mean ± SEM of freezing response. a, Design of the extinction experiment shown in b. All groups were trained at day 1; at day 2, animals were either reexposed for 30 min to the training context and injected with DMSO (E-DMSO) (n = 8) or with NFAT inhibitor (E-NFATinh) (n = 8), or were non-reexposed and injected with NFAT inhibitor (NoE-NFATinh) (n = 9). TR, Training session; Tctx, contextual test; Tcue, cued test. b, Effect of NFAT inhibition in contextual memory extinction. c, Design of the reconsolidation experiment shown in d. Groups are as in a, but for a 5 min reexposure: non-reexposed animals injected with NFAT inhibitor (NoR-NFATinh) (n = 8), reexposed injected with vehicle (R-DMSO) (n = 9) and reexposed injected with NFAT inhibitor (R-NFATinh) (n = 9). d, Effect of NFAT inhibition in contextual memory reconsolidation. **p < 0.05; one-way ANOVA comparing mean values of freezing of the three groups each day, followed by Newman–Keuls post hoc test.
Figure 7.
Figure 7.
CaN and NFATc4 nuclear translocation after extinction induction. Data are expressed as mean ± SEM nuclear translocation index. a, Design of the experiment. Animals were killed immediately (0 min time point), 15 or 45 min after 30 min extinction session (S-E). A point of −10 min was also performed, in which animals were killed immediately after 20 min extinction session. Three control groups were performed: naive group; trained animals, but not reexposed to the context on day 2 (S-NoE). Animals were placed in the training chamber on day 1, received the tones but not the shocks, and were reexposed 30 min on day (US-E). b, Schematic graph comparing CaN and NFATc4 mean ± SEM nuclear translocation index after extinction session in trained animals (S-E) compared with naive. Nuclear translocation indexes were estimated by densitometric analysis (ROD) of CaN and NFATc4 specific bands obtained by Western blots. Each time point was compared with its respective naive. c, Left, CaN mean ± SEM nuclear translocation index of killed animals after extinction session, compared with their respective naive groups; n = 12–17 in each group. Below graphs, The respective representative bands obtained by Western blots. Right, The same as in left but for NFATc4. d, Graphs showing no differences between control groups (S-NoE and US-E) on CaN or NFATc4 nuclear translocation. Below graphs, The respective representative bands obtained by Western blots. e, Effect of FK injection before extinction session, on CaN and NFATc4 nuclear translocation. Left, On day 2, trained animals were injected with FK or with DMSO, and reexposed for 30 min to the TR context. Forty-five minutes after extinction session, animals were killed, and CaN and NFAT nuclear translocation was assessed by Western blot. Right, The same as in left but for NFATc4. Below graphs, The respective representative bands obtained with Western blot. *p < 0.05; **p < 0.01; Student's t test.
Figure 8.
Figure 8.
Transcription factor switch between reconsolidation and extinction. Under a brief reexposure to the training context, transcription factor NF-κB is activated and induces its target genes expression. This brief stimulus leads to reconsolidation. In contrast, if the stimulus is prolonged, phosphatase CaN gets activated and blocks NF-κB activation. CaN also activates NFAT transcription factor by direct dephosphorylation. This, in turn, would activate its target genes expression. CaN and NFAT translocate to the nucleus as a complex, thus impeding the NFAT rephosphorylation. In this case, extinction of memory takes place.

Similar articles

Cited by

References

    1. Albensi BC, Mattson MP. Evidence for the involvement of TNF and NF-kappaB in hippocampal synaptic plasticity. Synapse. 2000;35:151–159. - PubMed
    1. Alberini CM. Transcription factors in long-term memory and synaptic plasticity. Physiol Rev. 2009;89:121–145. - PMC - PubMed
    1. Baumgärtel K, Genoux D, Welzl H, Tweedie-Cullen RY, Koshibu K, Livingstone-Zatchej M, Mamie C, Mansuy IM. Control of the establishment of aversive memory by calcineurin and Zif268. Nat Neurosci. 2008;11:572–578. - PubMed
    1. Biswas G, Anandatheerthavarada HK, Zaidi M, Avadhani NG. Mitochondria to nucleus stress signaling: a distinctive mechanism of NFkappaB/Rel activation through calcineurin-mediated inactivation of IkappaBbeta. J Cell Biol. 2003;161:507–519. - PMC - PubMed
    1. Boccia M, Freudenthal R, Blake M, de la Fuente V, Acosta G, Baratti C, Romano A. Activation of hippocampal nuclear factor-κB by retrieval is required for memory reconsolidation. J Neurosci. 2007;27:13436–13445. - PMC - PubMed

Publication types

MeSH terms