. 2011 Apr 13;31(15):5682-92.
doi: 10.1523/JNEUROSCI.5453-10.2011.

Recovery from short-term depression and facilitation is ultrafast and Ca2+ dependent at auditory hair cell synapses

Affiliations

Recovery from short-term depression and facilitation is ultrafast and Ca2+ dependent at auditory hair cell synapses

Soyoun Cho et al. J Neurosci. .

Abstract

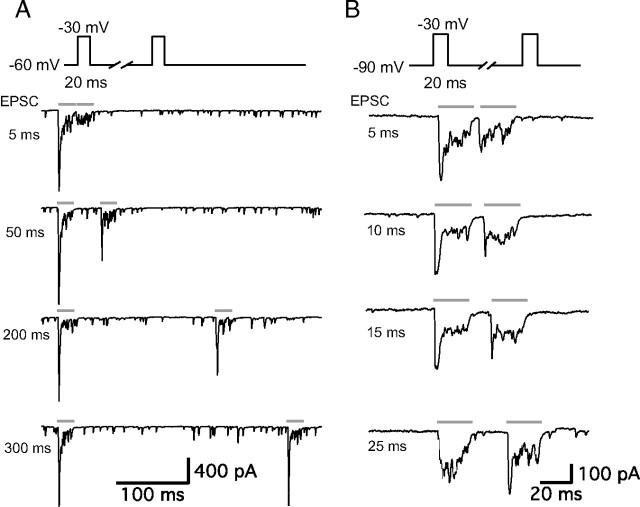
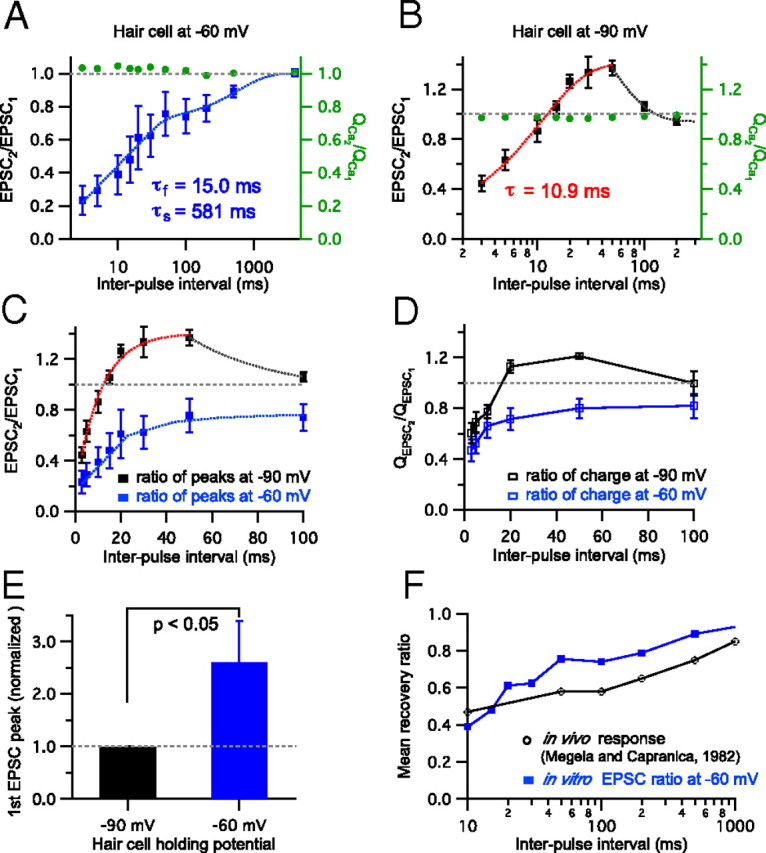
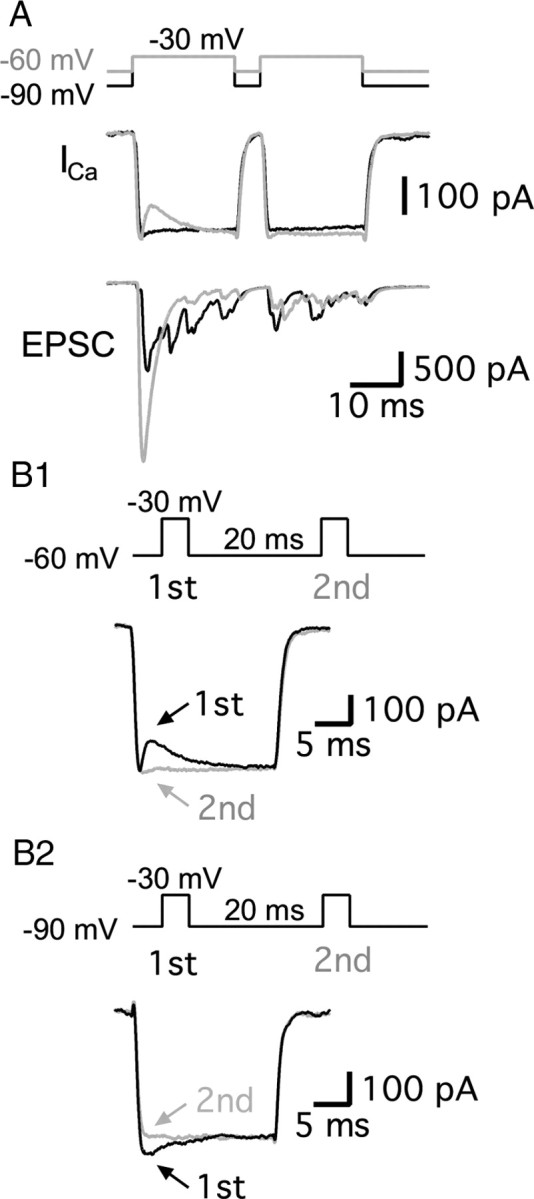
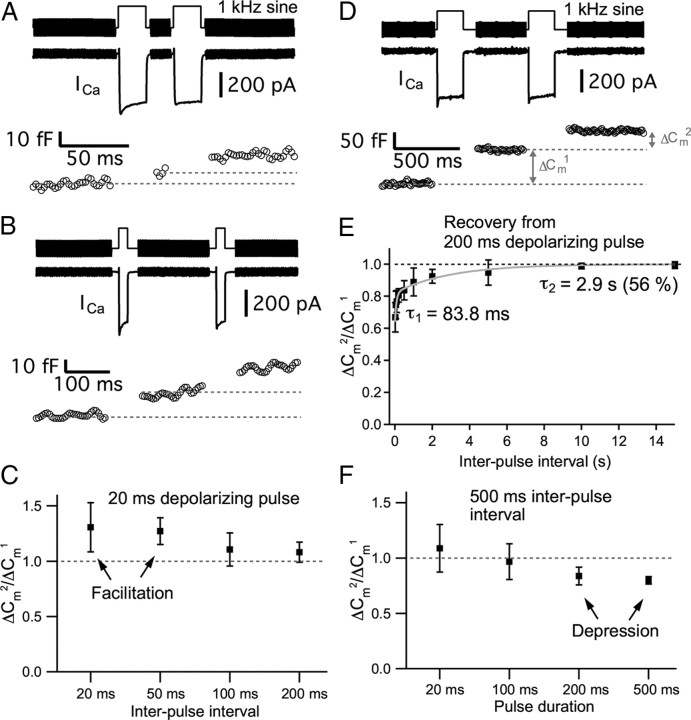
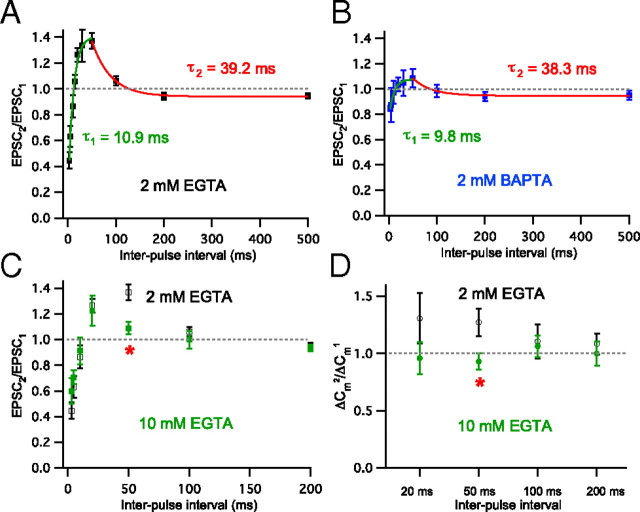
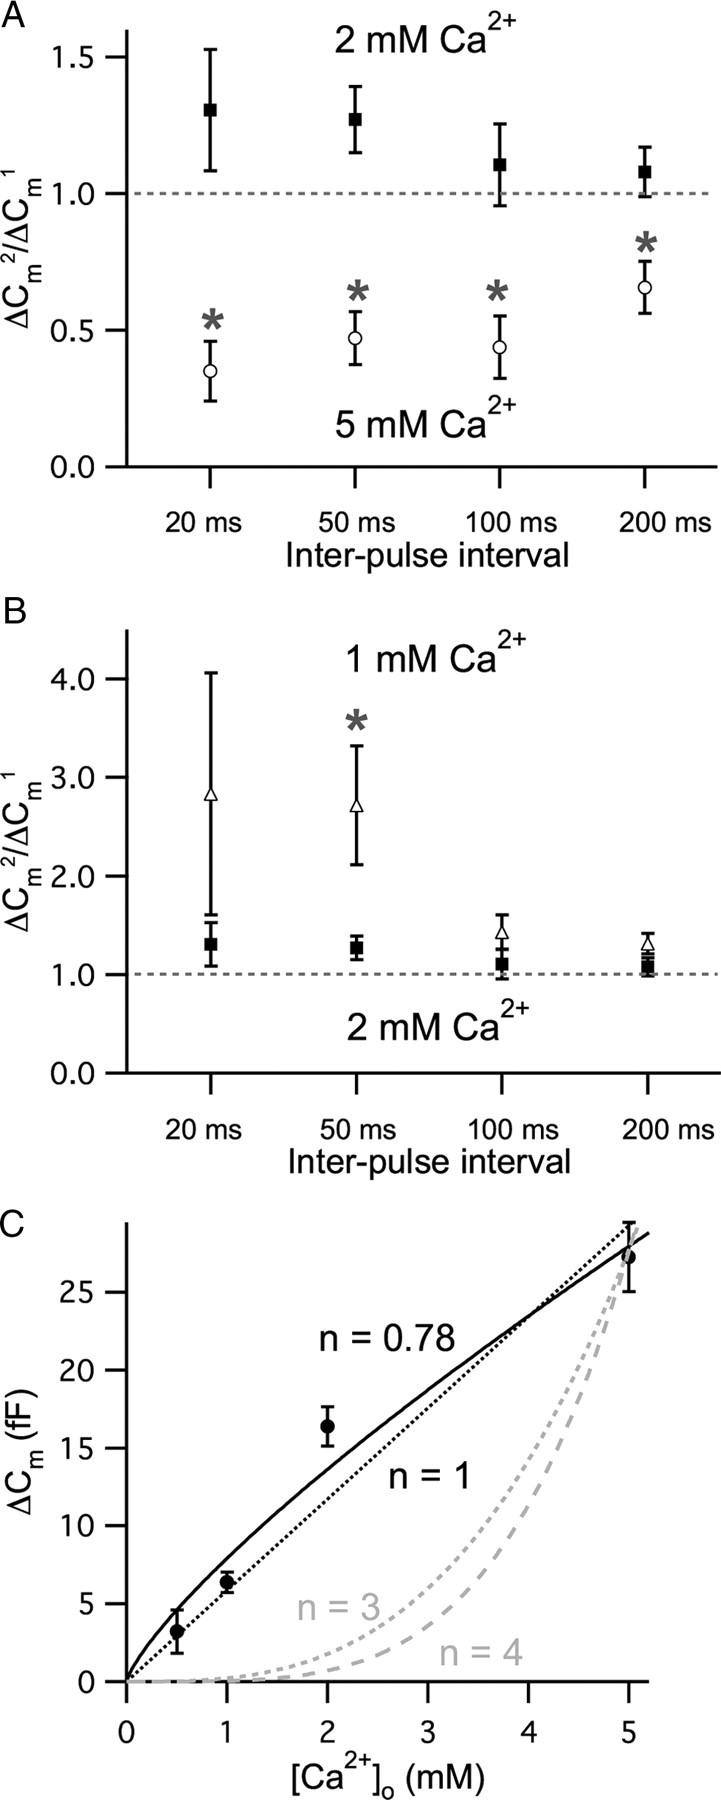
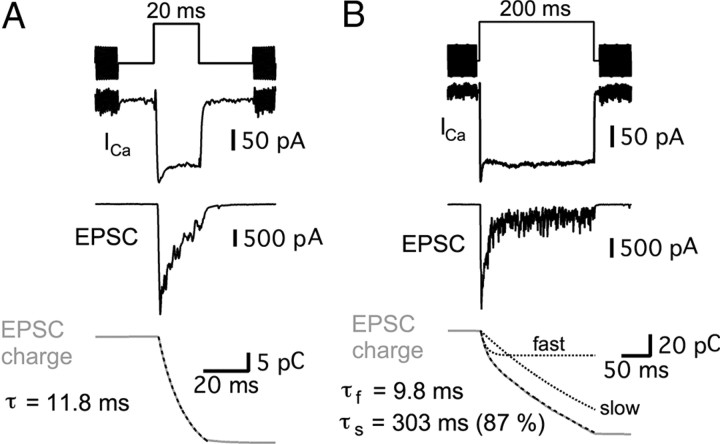
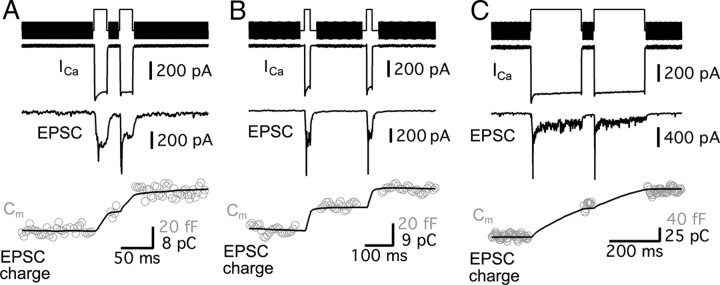
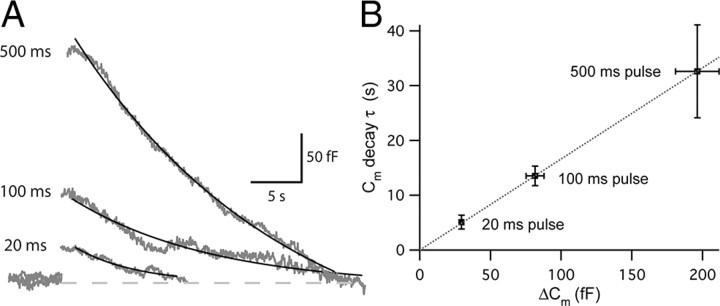
Short-term facilitation and depression coexist at many CNS synapses. Facilitation, however, has not been fully characterized at hair cell synapses. Using paired recordings and membrane capacitance measurements we find that paired-pulse plasticity at an adult frog auditory hair cell synapse depends on pulse duration and interpulse intervals. For short 20 ms depolarizing pulses, and interpulse intervals between 15 and 50 ms, facilitation occurred when hair cells were held at -90 mV. However, hair cells held at -60 mV displayed only paired-pulse depression. Facilitation was dependent on residual free Ca2+ levels because it was greatly reduced by the Ca2+ buffers EGTA and BAPTA. Furthermore, low external Ca2+ augmented facilitation, whereas depression was augmented by high external Ca2+, consistent with depletion of a small pool of fast releasing synaptic vesicles. Recovery from depression had a double-exponential time course with a fast component that may reflect the rapid replenishment of a depleted vesicle pool. We suggest that hair cells held at more depolarized in vivo-like resting membrane potentials have a tonic influx of Ca2+; they are thus in a dynamic state of continuous vesicle release, pool depletion and replenishment. Further Ca2+ influx during paired-pulse stimuli then leads to depression. However, at membrane potentials of -90 mV, ongoing release and pool depletion are minimized, so facilitation is revealed at time intervals when rapid vesicle pool replenishment occurs. Finally, we propose that vesicle pool replenishment kinetics is not rate limited by vesicle endocytosis, which is too slow to influence the rapid pool replenishment process.


Figures

Figure 1.
Figure 1.
Paired-pulse depression and facilitation of afferent fiber EPSCs. Paired recordings of EPSCs from an afferent fiber and a connected hair cell that was depolarized by a pair of 20-ms-long pulses (gray bars) from holding potentials of −60 mV (A) or from −90 mV (B) to −30 mV with various interpulse intervals. A, The stimulation protocol (top trace) and EPSCs with 5, 50, 200, and 300 ms interpulse intervals. The hair cell had a resting potential of −60 mV. Note the severe synaptic depression of the second EPSC for a 5 ms interpulse interval and the gradual recovery of the peak EPSC. B, The stimulation protocol (top trace) and EPSCs with 5, 10, 15, and 25 ms interpulse intervals. The hair cell had a resting potential of −90 mV. Note the faster recovery time course from depression of the EPSCs and the facilitation of the second peak EPSC at the 25 ms interpulse interval. Spontaneous EPSCs were also less frequent at a hair cell holding potential of −90 mV than at −60 mV.
Figure 2.
Figure 2.
Recovery from paired-pulse depression and facilitation. EPSCs were recorded from the afferent fiber while a connected hair cell was depolarized by a pair of 20 ms long pulses with various interpulse intervals. The Ca2+ influx charge ratio mediated by hair-cell open Ca2+ channels during the pulse was calculated by integrating the Ca2+ currents. A, The paired-pulse peak EPSC ratio with hair cells held at −60 mV and interpulse intervals varied from 3 ms to 4 s. Data were plotted with a logarithmic scale on interpulse interval (n = 4–9 paired recordings per data point). The EPSC paired-pulse ratio recovered exponentially with fast (τf = 15.0 ms; 64%) and slow (τs = 581 ms) time constants (the blue dashed curve shows the exponential fits). The gray dashed line indicates that the ratio is 1 (EPSC2 = EPSC1). The ratio of Ca2+ charge (QCa2/QCa1) was ∼1 (0.99–1.05; green, right axis). B, The EPSC peak ratios with hair cells held at −90 mV (n = 4–8). The red dashed line shows a single exponential fit. From 3 ms to 50 ms intervals, the paired-pulse ratio increased exponentially (τ = 10.9 ms). QCa2/QCa1 was relatively constant (0.96–0.99; green, right axis). C, The relationship between EPSC peak ratios and interpulse intervals (3–100 ms) when hair cells were held at −90 mV (n = 4–8) and at −60 mV (n = 5–9). D, The relationship between EPSC charge ratios and interpulse intervals (3–100 ms) when hair cells were held at −90 mV (n = 6) and at −60 mV (n = 4–6). E, The peak amplitudes of the first EPSCs for hair cells held at −60 mV were normalized to the first EPSCs at −90 mV. For seven paired recordings, the normalized peak of the first EPSC at −60 mV increased significantly (2.6 ± 0.8; n = 7). F, Paired-pulse depression of hair cells held at −60 mV (blue filled square; same data as in A) shows recovery rates similar to that of in vivo fast-adapting afferent fiber spikes recovering from a pure tone sound stimulus in R. pipiens frogs (black open square; modified with permission from Megela and Capranica, 1982).
Figure 3.
Figure 3.
A comparison of Ca2+ currents from hair cells held at −60 and −90 mV. A, Hair cells were depolarized from −60 mV (gray) or −90 mV (black) to −30 mV for 20 ms with 5 ms interpulse intervals in the same paired recording. Ca2+ currents (ICa) showed similar peaks at both holding potentials, but the first ICa at −60 mV showed a transient outward component (or Ca2+ current inhibition). Note the larger first pulse EPSC amplitude when hair cells are held at −60 mV and the strong paired-pulse depression (gray trace). B1, B2, Ca2+ currents were evoked by a pair of 20 ms pulses with a 20 ms interpulse interval from holding potentials of −60 mV (B1) or −90 mV (B2) to −30 mV at the same hair cell. The first Ca2+ currents (black) and the second Ca2+ currents (gray) were superimposed. At −60 mV, the first Ca2+ current showed a transient outward component (B1). At −90 mV, the first Ca2+ current showed a slightly larger peak (B2).
Figure 4.
Figure 4.
Paired-pulse depression and facilitation measured with Cm changes from hair cells. Hair cells were depolarized from −90 to −30 mV. A, ICa and ΔCm evoked by a pair of 20 ms pulses with 20 ms interpulse interval shows paired-pulse facilitation (ΔCm2Cm1 > 1). B, ICa and ΔCm evoked by a pair of 20 ms pulses with 200 ms interpulse interval. ΔCm2Cm1 was close to 1. C, The averaged ratio of ΔCmCm2Cm1) evoked by a pair of 20 ms voltage steps from −90 to −30 mV with interpulse interval of 20, 50, 100, and 200 ms. D, ICa and ΔCm evoked by a pair of 200 ms pulses with 500 ms interpulse interval. E, Recovery from depression elicited by a pair of 200 ms pulses. The averaged ΔCm2Cm1 was measured with various interpulse intervals (20 ms, 50 ms, 100 ms, 200 ms, 500 ms, 1 s, 2 s, 5 s, 10 s, and 15 s; n = 4–17). Paired-pulse depression recovered with a two exponential time course with time constants of 83.8 ms (τ1) and 2.9 s (τ2). F, ΔCm evoked by a pair of voltage steps from −90 to −30 mV for various durations (20, 100, 200, and 500 ms) with 500 ms interpulse interval. The dashed line indicates that ΔCm2Cm1 is 1.
Figure 5.
Figure 5.
Ca2+ buffer dependence of paired-pulse ratios. EPSCs were elicited with a pair of 20 ms pulses from −90 to −30 mV (A–C). In A and B, EPSCs were recorded from afferent fibers while the hair cells were depolarized by a pair of 20 ms voltage steps from −90 to −30 mV with various interpulse intervals (3–500 ms). The averaged paired-pulse ratios of EPSC peak amplitudes (EPSC2/EPSC1) were fit by exponentials (green and red lines). In D, paired-pulse ratio was calculated from ΔCm evoked by a pair of 20 ms voltage steps from −90 to −30 mV with interpulse interval of 20, 50, 100, and 200 ms. A, The averaged EPSC2/EPSC1 with 2 mm EGTA as an internal calcium buffer in hair cells (black; n = 6–9). EPSC2/EPSC1 with interpulse intervals from 3 to 50 ms (3, 5, 10, 15, 20, 30, and 50 ms) increased exponentially (τ1 = 10.9 ms, green). The red line shows a single exponential fit with a time constant of 39.2 ms. B, The averaged EPSC2/EPSC1 with 2 mm BAPTA as an internal calcium buffer in hair cells (blue; n = 4–8). EPSC2/EPSC1 values with 3, 20, and 50 ms interpulse intervals were significantly different from those of 2 mm EGTA (p < 0.05). The time constant of a single exponential fit between the 3 ms and 50 ms intervals was 9.8 ms (τ1; green) and the exponential time constant between 50 ms and 500 ms intervals was 38.3 ms (τ2; red). C, The averaged paired-pulse ratio of EPSCs (3, 5, 10, 20, 50, 100, and 200 ms interpulse intervals) with 10 mm EGTA internal calcium buffer in the hair cells (green squares; n = 4–9). The averaged paired-pulse ratio with 10 mm EGTA was significantly decreased only for the 50 ms interval compared with 2 mm EGTA (red asterisk, p < 0.05). D, With 10 mm EGTA (green filled circle), ΔCm2Cm1 was not significantly different from 2 mm EGTA (black open square, same data as in with Fig. 4C) except for the data point with 50 ms interval (red asterisk; p < 0.05).
Figure 6.
Figure 6.
Dependence of paired-pulse ratios on external Ca2+ concentration. ΔCm evoked by a pair of 20 ms voltage steps from −90 to −30 mV with interpulse intervals of 20, 50, 100, and 200 ms with 2 mm EGTA as an internal Ca2+ buffer. A, When the external Ca2+ concentration was increased from 2 mm (filled squares) into 5 mm (open circles), the averaged paired-pulse ratios of ΔCm with interpulse intervals ranging from 20 to 200 ms were significantly decreased (n = 7–9; asterisk; p < 0.001). B, When the external Ca2+ concentration decreased to 1 mm (open triangles), the averaged paired-pulse ratios of ΔCm with interpulse intervals ranging from 20 to 200 ms were increased (n = 5–9) comparing with data in 2 mm external Ca2+ (filled squares). The ratio especially with 50 ms interval was significantly increased (asterisk; p < 0.001). C, The relationship between ΔCm and external Ca2+ concentration ([Ca2+]o) for a 20 ms long-depolarizing pulse (n = 11–17). The lines are fits using the equation ΔCm = A · [Ca2+]n. The best fit to the data is shown by the black solid line (n = 0.78). The gray dashed lines (n = 3 or n = 4) demonstrate the third and the fourth power relationships between [Ca2+]o and ΔCm, respectively. The black dashed line is a linear fit (R2 = 0.95).
Figure 7.
Figure 7.
Prolonged hair cell depolarizations evoke EPSCs with two kinetic components. Paired recordings of hair-cell Ca2+ currents (ICa) and EPSCs from the connected afferent fiber. A, B, Examples of EPSCs evoked with 20 ms (A) and 200 ms (B) step depolarizations from a holding potential of −90 to −30 mV at the same hair cell to afferent fiber synapse. Black dashed lines are exponential fits of calculated EPSC charges (gray). With a 20 ms pulse, the exponential time constant (τ) was 11.8 ms. The EPSC charge transfer (gray) evoked by a 200 ms stimulus shows fast and slow components. The time constant of the fast component (τf) was 9.8 ms and the time constant of the slow component (τs) was 303 ms (87% of the total amplitude). The dashed black lines show the fast and slow components of the double-exponential fit to the data.
Figure 8.
Figure 8.
Paired recordings and simultaneous ΔCm measurements. A–C, EPSCs mediated by AMPA receptors are not significantly desensitized or saturated during exocytosis with pairs of 20 ms (A, B) or 200 ms (C) depolarizing pulses from a holding potential of −90 to −30 mV in hair cell synapses. Presynaptic ICa, Cm (gray open circle, bottom), and afferent fiber EPSC were simultaneously recorded while a voltage-clamped hair cell was depolarized by a pair of 20 ms pulses with 20 ms interpulse interval (A), by a pair of 20 ms pulses with 200 ms interpulse interval (B), or by a pair of 200 ms pulses with 50 ms interpulse interval (C). The intermediate changes of EPSC charge transfer (black lines) are well correlated with the increases of ΔCm (gray open circles) after the traces are normalized to the peak EPSC and ΔCm changes.
Figure 9.
Figure 9.
The coupling of exocytosis to endocytosis at hair cell synapses. The kinetics of endocytosis was measured using the nystatin-perforated patch mode of recording. A, Cm traces with 20, 100, and 500 ms, long step depolarizations from −90 to −30 mV (gray). The decay of Cm was fit with a single exponential function (black). B, The relationship between the ΔCm and the Cm decay time constant (τ) shows a linear relationship (R2 = 0.99997). The rate of endocytosis is thus faster when the amount of exocytosis is smaller.

References

    1. Abreu BJ, Guimarães M, Uliana LC, Vigh J, von Gersdorff H, Prado MA, Guatimosim C. Protein kinase C modulates synaptic vesicle acidification in a ribbon type nerve terminal in the retina. Neurochem Int. 2008;53:155–164. - PMC - PubMed
    1. Awatramani GB, Price GD, Trussell LO. Modulation of transmitter release by presynaptic resting potential and background calcium levels. Neuron. 2005;48:109–121. - PubMed
    1. Babai N, Bartoletti TM, Thoreson WB. Calcium regulates vesicle recruitment at the cone ribbon synapse. J Neurosci. 2010;30:15866–15877. - PMC - PubMed
    1. Bartoletti TM, Babai N, Thoreson WB. Vesicle pool size at the salamander cone ribbon synapse. J Neurophysiol. 2010;103:419–423. - PMC - PubMed
    1. Betz WJ. Depression of transmitter release at the neuromuscular junction of the frog. J Physiol. 1970;206:629–644. - PMC - PubMed

Publication types

MeSH terms

LinkOut - more resources