. 2011 Apr 13;31(15):5764-76.
doi: 10.1523/JNEUROSCI.6015-10.2011.

The Down syndrome critical region regulates retinogeniculate refinement

Affiliations

The Down syndrome critical region regulates retinogeniculate refinement

Martina Blank et al. J Neurosci. .

Abstract

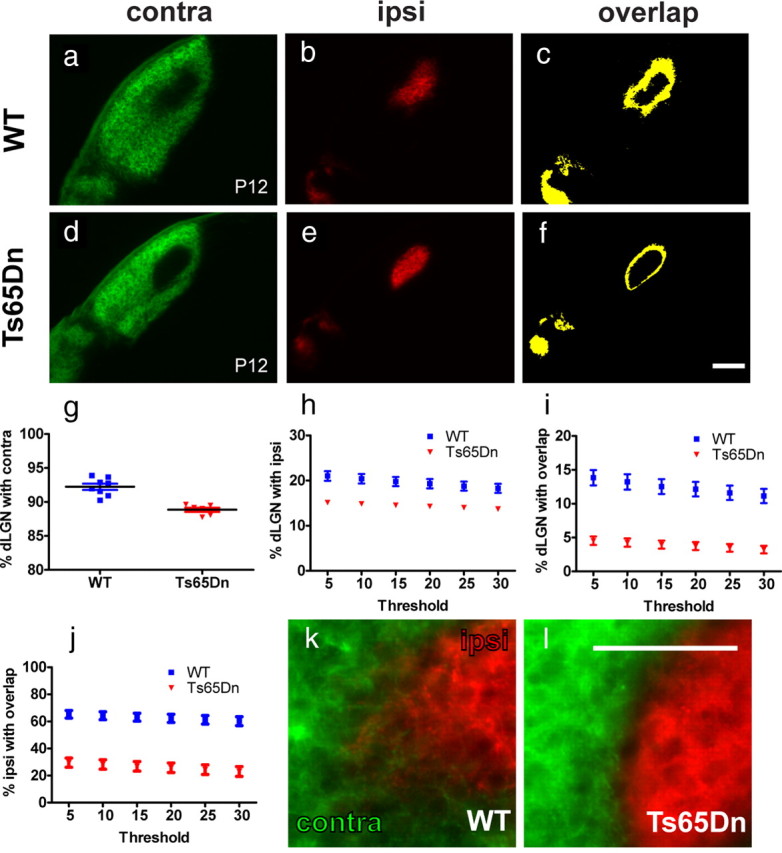
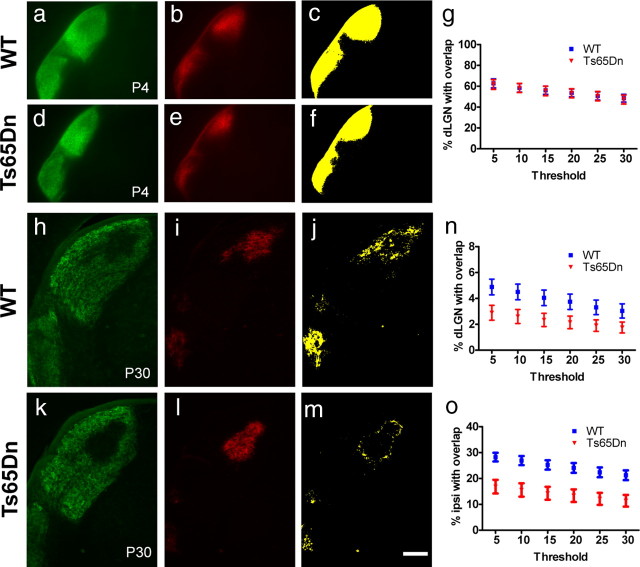
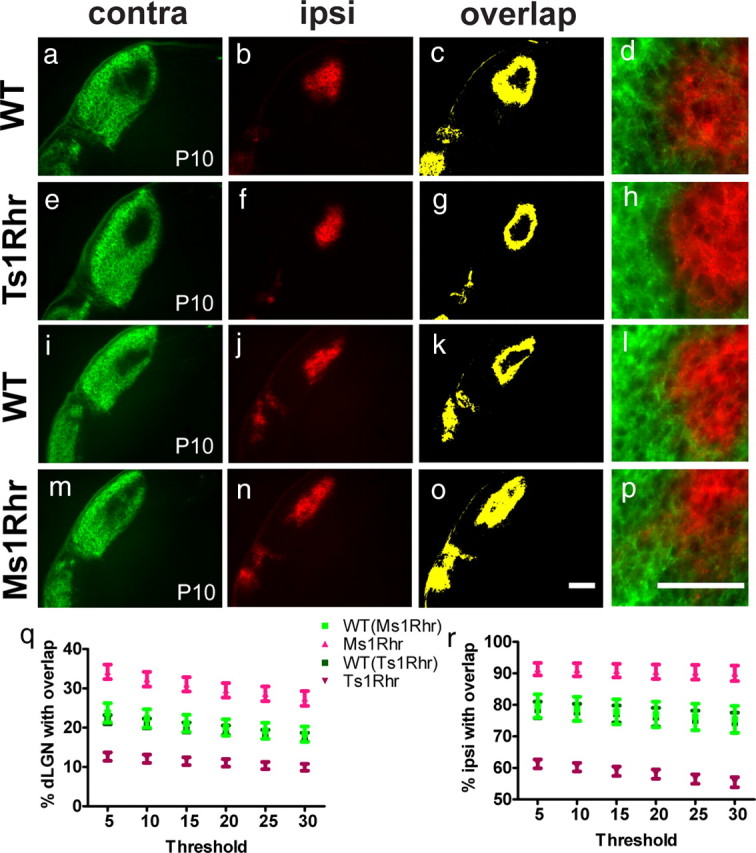
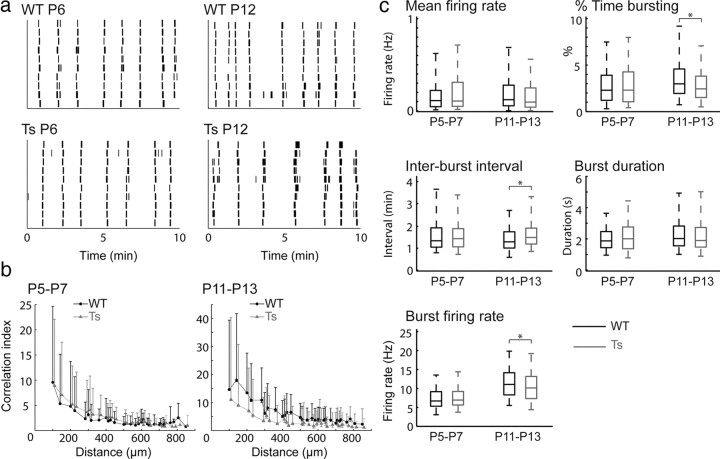
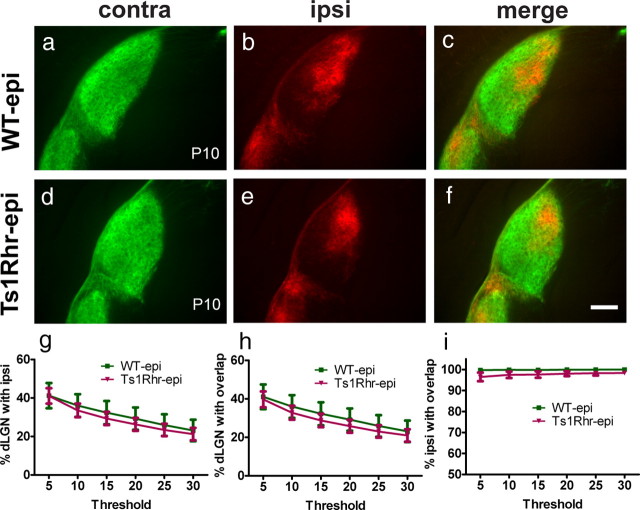
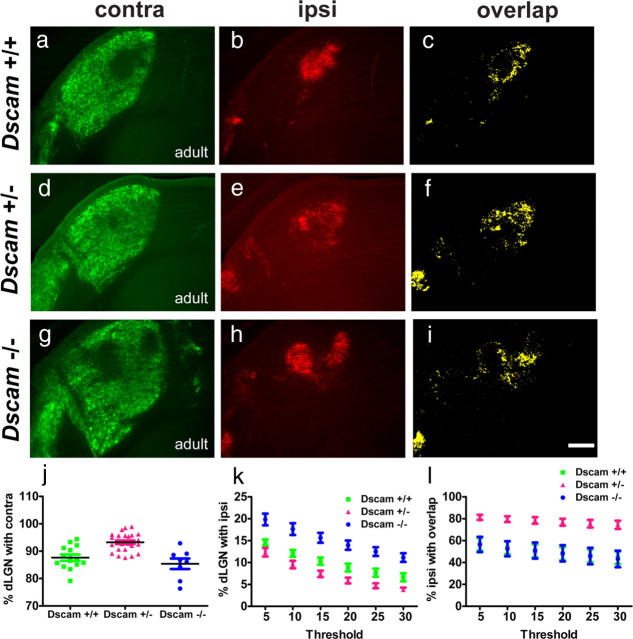
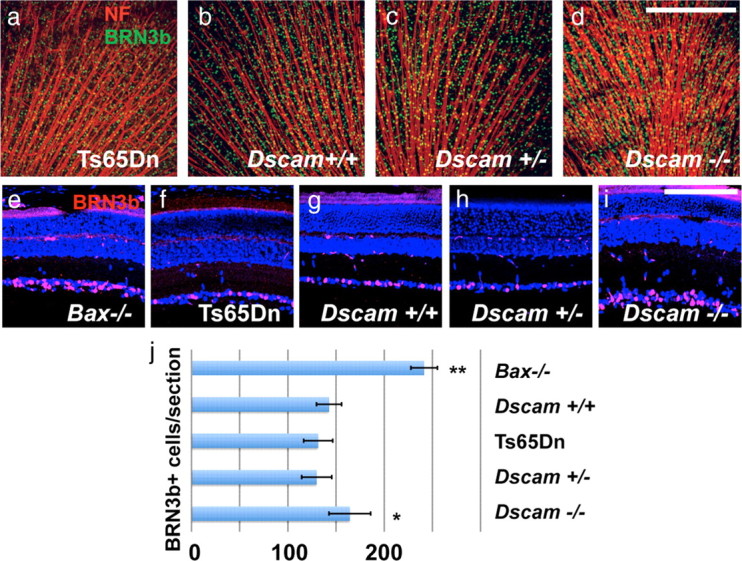
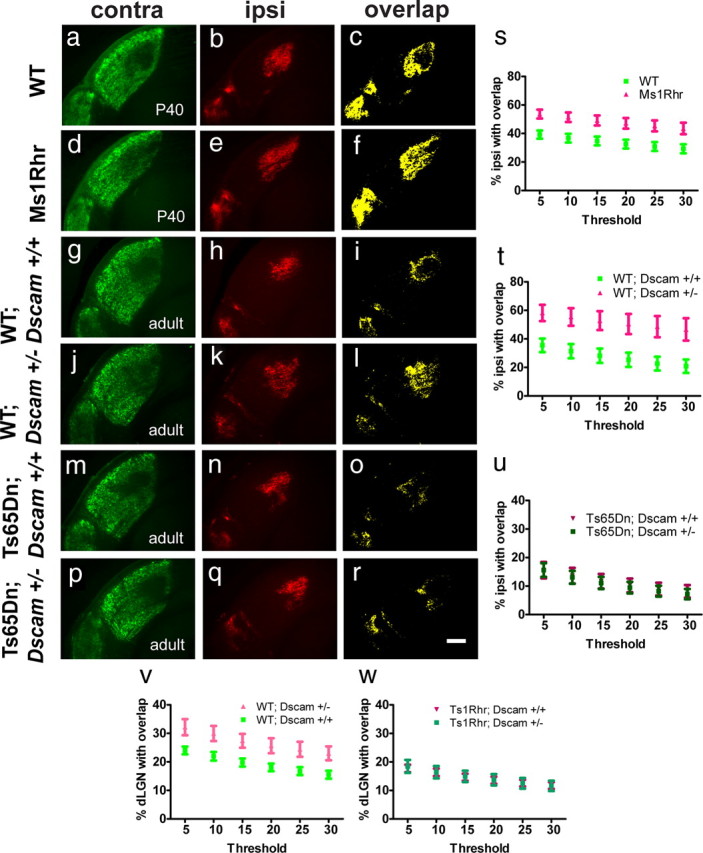
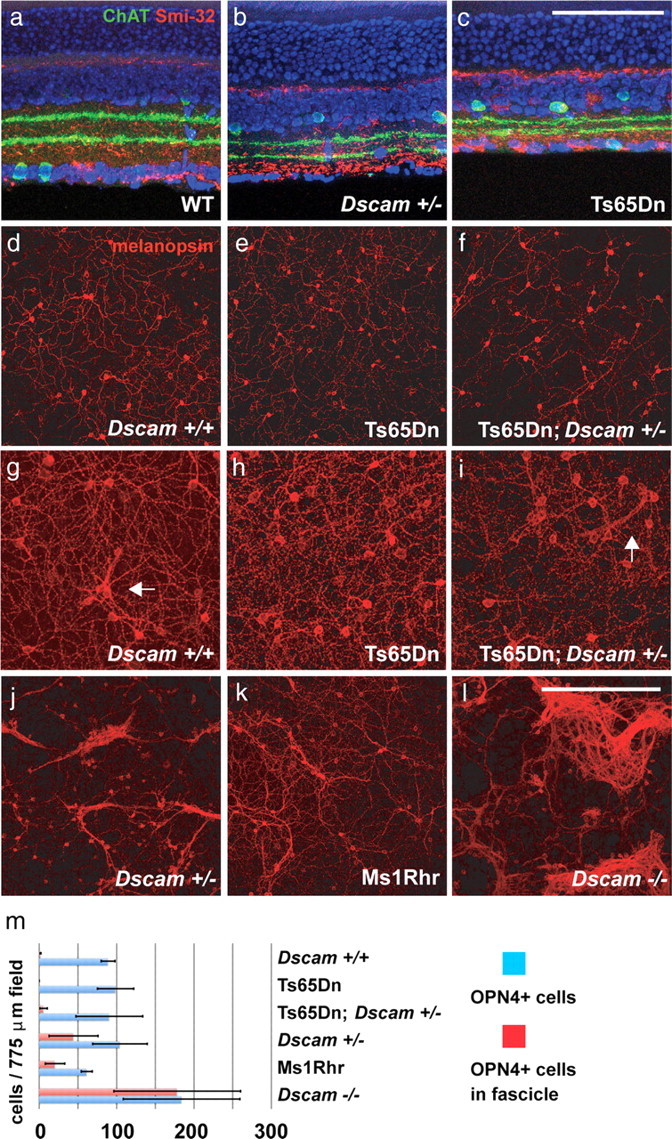
Down syndrome (DS) is a developmental disorder caused by a third chromosome 21 in humans (Trisomy 21), leading to neurological deficits and cognitive impairment. Studies in mouse models of DS suggest that cognitive deficits in the adult are associated with deficits in synaptic learning and memory mechanisms, but it is unclear whether alterations in the early wiring and refinement of neuronal circuits contribute to these deficits. Here, we show that early developmental refinement of visual circuits is perturbed in mouse models of Down syndrome. Specifically, we find excessive eye-specific segregation of retinal axons in the dorsal lateral geniculate nucleus. Indeed, the degree of refinement scales with defects in the "Down syndrome critical region" (DSCR) in a dose-dependent manner. We further identify Dscam (Down syndrome cell adhesion molecule), a gene within the DSCR, as a regulator of eye-specific segregation of retinogeniculate projections. Although Dscam is not the sole gene in the DSCR contributing to enhanced refinement in trisomy, Dscam dosage clearly regulates cell spacing and dendritic fasciculation in a specific class of retinal ganglion cells. Thus, altered developmental refinement of visual circuits that occurs before sensory experience is likely to contribute to visual impairment in individuals with Down syndrome.


Figures

Figure 1.
Figure 1.
Trisomic mice have enhanced segregation of retinogeniculate projections before eye opening. a–f, Photomicrographs of coronal sections showing contra and ipsi retinal projections to the dLGN at P12. a–c, WT animals show a significant degree of overlap between ipsi and contra projections indicated in yellow in the overlap image. d–f, In Ts65Dn mice, ipsi and contra projections are abnormally strongly segregated, resulting in less overlap compared with WT controls. g, The area occupied by contra projections normalized to the total area of the dLGN is significantly smaller in Ts65Dn mice (p = 0.0001). h, The relative ipsi area in Ts65Dn mice is also smaller across a range of thresholds (p < 0.01). i, The relative overlap area is consistently smaller in Ts65Dn mice at several different thresholds (p < 0.0001). j, The percentage ipsi area overlapping with contra projections is significantly lower in Ts65Dn mice across all thresholds (p < 0.0001). k, l, Merged images show that ipsi and contra projections intermingle to a certain degree at the contra/ipsi border in WT but not Ts65Dn animals. Graphs show the mean ± SEM; n = 8 (WT) and n = 6 (Ts65Dn); two-tailed t test. Scale bar: f, 200 μm; l, 100 μm.
Figure 2.
Figure 2.
Initial targeting of retinogeniculate projections to the dLGN is normal in trisomic animals, and enhanced eye-specific segregation persists into adulthood. Contra and ipsi projections are targeted to the appropriate areas in the dLGN in WT (a–c) and Ts65Dn (d–f) mice at P4. Contra projections fill the entire and ipsi projections a large portion of the dLGN, leading to substantial overlap shown in yellow (c, f). g, The relative overlap area shows no significant differences between genotypes at all thresholds analyzed. Compared with WT mice (h–j), adult Ts65Dn mice (k–m) show stronger segregation of contra and ipsi projections and less overlap (j, m). n, The relative overlap area is significantly different between genotypes at the three lowest thresholds (p < 0.05). o, The percentage ipsi area overlapping with contra is also consistently different across thresholds (p < 0.01). Graphs show the mean ± SEM; n = 7 (WT, P4) and n = 6 (Ts65Dn, P4); n = 8 (WT, P30) and n = 11 (Ts65Dn, P30); two-tailed t test. Scale bar, 200 μm.
Figure 3.
Figure 3.
The DSCR regulates eye-specific segregation in a dosage-dependent manner. P10 LGN of WT mice (a–d, i–l) and animals carrying either three (Ts1Rhr; e–h) or one (Ms1Rhr; m–p) copy of the DSCR: compared with WT littermates, contra and ipsi projections show less overlap in Ts1Rhr (c, g), and more overlap in Ms1Rhr as seen in yellow (l, p). q, The relative overlap area is significantly decreases in Ts1Rhr (p < 0.001) and significantly increased in Ms1Rhr (p < 0.01) mice across all thresholds. r, The percentage ipsi area overlapping with contra is also reduced in Ts1Rhr animals (p < 0.001) and increased in Ms1Rhr mice (p < 0.05) when compared with WT controls at all thresholds. Graphs show the mean ± SEM; n = 6 (WT) and n = 6 (Ts1Rhr); n = 8 (WT) and n = 6 (Ms1Rhr); two-tailed t test. Scale bar (in o), 200 μm. d, h, l, p, Zoomed-in views of the contra/ipsi border in the dLGN of P10 trisomic and monosomic mice reveal that trisomy (Ts1Rhr) causes contra and ipsi projections to avoid each other's territory, whereas monosomy (Ms1Rhr) prevents segregation of eye-specific projections. Scale bar (in p), 100 μm.
Figure 4.
Figure 4.
Ts1Rhr mice have normal spontaneous retinal activity during development. a, Raster plots of 10 single-unit spike trains over a 10 min interval, recorded from retinas isolated from a P6 WT (top left) and Ts1Rhr (Ts, bottom left) littermate and a P12 WT (top right) and Ts (bottom right) littermate. (The 10 single units selected corresponded to those with the highest mean firing rate in each sample.) b, Pairwise correlation index as a function of intercellular distance for WT (black circles) and Ts (gray triangles) littermates at P5–P7 (left, averaged across 7 retinas per genotype) and P11–P13 (right, averaged across 4 retinas per genotype). The data points correspond to median values and the upper error bars are the 75th percentile. [The bottom error bars (25th percentile) stretched to a correlation index of <1 in all cases and have been omitted for clarity.] c, Summary of the temporal properties of spontaneous firing patterns for retinas isolated from WT (black) and Ts (gray) littermates at P5–P7 and P11–P13. Data are averaged over mean values for each cell of a given age and genotype (P5–P7, 7 retinas per genotype; P11–P13, 4 retinas per genotype). The boxes correspond to medians and quartiles and the whiskers to 5 and 95%. Asterisks imply a significant difference in medians at the 1% significance level as determined by a Wilcoxon's rank sum test; p values for all measurements are listed in Table 1.
Figure 5.
Figure 5.
Altering spontaneous retinal waves with epibatidine prevents eye-specific segregation in Ts1Rhr mice and wild-type littermate controls. WT (a–c) and Ts1Rhr (d–f) mice received intravitreal injections of epibatidine (epi) at P3, P5, P7, and P8 and a CTβ injection at P9. Contra projections (a, d) cover the entire dLGN in WT–epi and Ts1Rhr–epi mice at P10, and ipsi projections are not confined to the ipsi patch in both genotypes (b, e), leading to a complete overlap of the ipsi area with the contra projections (c, f). Accordingly, no significant differences were observed in the relative ipsi and overlap areas when comparing WT–epi and Ts1Rhr–epi animals (g–i). Graphs show the mean ± SEM; n = 4 (WT), n = 6 (Ts1Rhr); two-tailed t test. Scale bar, 200 μm.
Figure 6.
Figure 6.
Dscam regulates eye-specific segregation in the dorsal LGN. Compared with WT Dscam+/+ controls (a–c), heterozygous Dscam+/− mice show a lack of segregation in the dLGN. Contra projections cover almost the entire dLGN, and ipsi projections fail to accumulate in the ipsi patch (d–f). Homozygous Dscam−/− mice exhibit an altered pattern of segregation with more than one ipsi patch (g–i). j, The relative contra area is significantly larger in Dscam+/− mice compared with WT controls (p < 0.0001) and Dscam−/− mice (p < 0.0001). k, Compared with WT controls, the relative ipsi area is significantly smaller in Dscam+/− (p < 0.05) for the four highest thresholds and significantly larger in Dscam−/− (p < 0.01) across all thresholds. l, The relative ipsi area overlapping with contra was significantly larger in Dscam+/− animals compared with WT controls (p < 0.0001) and compared with Dscam−/− animals (p < 0.001) at all thresholds. Graphs show the mean ± SEM; n = 14 (WT), n = 26 (Dscam+/−), and n = 8 (Dscam−/−); two-tailed t test. Scale bar, 200 μm.
Figure 7.
Figure 7.
Effect of Dscam dosage changes on RGC number. a–d, Retinas stained with antibodies to neurofilament (NF) and BRN3b, a marker of most RGCs. Axons project toward the optic disk in Ts65Dn, Dscam+/+, Dscam+/−, and Dscam−/− retinas at postnatal day 15 (n > 3). Scale bar (in d), 387.5 μm. e–j, BRN3b-postive RGC number is increased in Dscam−/− retinas compared with Ts65Dn, Dscam+/+, or Dscam+/− retinas (p < 0.05; n > 3). Bax−/− mice, which are deficient in normal developmental cell death, had a statistically significant (p < 0.01) increase in the number of RGCs compared with all other genotypes. No significant difference was detected between the number of BRN3b-positive RGCs in Dscam+/+, Dscam+/−, and Ts65Dn retinas. Scale bar (in i), 46.6 μm.
Figure 8.
Figure 8.
Circuit refinement in the dLGN is perturbed by a decrease in Dscam dosage. Compared with littermate controls (a–c) adult Ms1Rhr mice (d–f) still show a lack of eye-specific segregation and more overlap (c, f). Similarly, compared with WT controls with two copies of Dscam (WT; Dscam+/+; g–i) eye-specific segregation is impaired in WT mice carrying only one copy of Dscam (WT; Dscam+/−; j–l). Contra projections cover a majority of the dLGN in WT; Dscam+/− mice but have retracted from the ipsi territory in WT; Dscam+/+ animals. This leads to substantially more overlap in WT; Dscam+/− mice as seen in yellow (i, l). However, trisomic Ts65Dn animals with three copies of Dscam (Ts65Dn; Dscam+/+; m–o) are indistinguishable from trisomic Ts65Dn animals with two copies (Ts65Dn; Dscam+/−; p–r). Accordingly, the percentage ipsi area overlapping with contra is significantly higher in Ms1Rhr mice (p < 0.01; s) and WT; Dscam+/− animals (p < 0.05; t) than in WT controls but not significantly different in trisomic Ts65Dn animals with two or three copies of Dscam (u). Graphs show the mean ± SEM; n = 10 (WT) and n = 8 (Ms1Rhr); n = 6 (WT; Dscam+/+) and n = 10 (WT; Dscam+/−); n = 6 (Ts65Dn; Dscam+/+) and n = 12 (Ts65Dn; Dscam+/−); two-tailed t test. Scale bar, 200 μm. v, w, Reducing Dscam to one copy in the context of trisomy of the DSCR (TsRhr1) prevents eye-specific segregation in the dLGN at P10. v, The relative overlap area is significantly larger in WT; Dscam+/− animals compared with WT; Dscam+/+ controls (p < 0.05) across all thresholds. w, However, the relative overlap area is not significantly different in Ts1Rhr; Dscam+/+ animals and Ts1Rhr; Dscam+/− animals at any threshold. Graphs show the mean ± SEM; n = 6 (WT; Dscam+/+) and n = 4 (WT; Dscam+/−); n = 9 (Ts1Rhr; Dscam+/+) and n = 8 (Ts1Rhr; Dscam+/−); two-tailed t test.
Figure 9.
Figure 9.
Fasciculation of intrinsically photoresponsive RGCs is sensitive to increase and decrease in Dscam dosage. a–c, Cholinergic amacrine cells and α-RGC lamination in WT, Dscam+/−, and Ts65Dn retinas. Sections of retina were stained with antibodies to ChAT to label cholinergic amacrine cells and Smi-32 to label α-RGCs. No significant difference was observed when comparing the lamination of neurites in the inner plexiform layer. Scale bar (in c), 146 μm. d–l, Whole retinas stained with an antibody to melanopsin to label ipRGCs. d–f, ipRGCs in Dscam+/+ (n > 3), Ts65Dn (n > 3), and retinas from Ts65Dn mice carrying a single mutant allele of Dscam (Ts65Dn; Dscam+/−; n > 3). Little or no fasciculation of ipRGCs was observed in these retinas. g, Occasionally, isolated instances of fasciculation were observed in the Dscam+/+ retina (n = 12). h, This limited fasciculation was never observed in the retinas of Ts65Dn littermates (n = 18). i, Ts65Dn; Dscam+/− mice (n = 14) have a degree of fasciculation similar to what is observed in Dscam+/+ littermate controls. j–l, Retinas from mice carrying one or two Dscam null alleles have a dramatic level of dendrite fasciculation. j, ipRGCs within the retina of a Dscam+/− mouse (n > 3). k, ipRGCs within the retina of a mouse carrying one copy of the DSCR (Ms1Rhr; n > 3). l, ipRGCs within the retina of a Dscam−/− mouse (n > 3). The total number of fasciculation events were counted in each retina and used to perform a two-tailed t tests (Dscam+/+ vs Ts65Dn, p = 0.018; Ts65Dn vs Ts65Dn; Dscam+/−, p = 0.003; and Dscam+/+ vs Ts65Dn; Dscam+/−, p = 0.62). Scale bar (in l): d–f, j–l, 387.5 μm; g–i, 193.75 μm. m, Number of ipRGCs and number of fasciculated ipRGCs counted in representative fields from each genotype in d–l (n = 3).

References

    1. Barlow GM, Chen XN, Shi ZY, Lyons GE, Kurnit DM, Celle L, Spinner NB, Zackai E, Pettenati MJ, Van Riper AJ, Vekemans MJ, Mjaatvedt CH, Korenberg JR. Down syndrome congenital heart disease: a narrowed region and a candidate gene. Genet Med. 2001;3:91–101. - PubMed
    1. Barlow GM, Micales B, Chen XN, Lyons GE, Korenberg JR. Mammalian DSCAMs: roles in the development of the spinal cord, cortex, and cerebellum? Biochem Biophys Res Commun. 2002;293:881–891. - PubMed
    1. Becker LE, Armstrong DL, Chan F. Dendritic atrophy in children with Down's syndrome. Ann Neurol. 1986;20:520–526. - PubMed
    1. Belichenko NP, Belichenko PV, Kleschevnikov AM, Salehi A, Reeves RH, Mobley WC. The “Down syndrome critical region” is sufficient in the mouse model to confer behavioral, neurophysiological, and synaptic phenotypes characteristic of Down syndrome. J Neurosci. 2009;29:5938–5948. - PMC - PubMed
    1. Bjartmar L, Huberman AD, Ullian EM, Rentería RC, Liu X, Xu W, Prezioso J, Susman MW, Stellwagen D, Stokes CC, Cho R, Worley P, Malenka RC, Ball S, Peachey NS, Copenhagen D, Chapman B, Nakamoto M, Barres BA, Perin MS. Neuronal pentraxins mediate synaptic refinement in the developing visual system. J Neurosci. 2006;26:6269–6281. - PMC - PubMed

Publication types

MeSH terms

LinkOut - more resources