. 2011 Apr 13;31(15):5804-15.
doi: 10.1523/JNEUROSCI.5127-10.2011.

Somatic depolarization enhances GABA release in cerebellar interneurons via a calcium/protein kinase C pathway

Affiliations

Somatic depolarization enhances GABA release in cerebellar interneurons via a calcium/protein kinase C pathway

Brice Bouhours et al. J Neurosci. .

Abstract

In cortical and hippocampal neurons, tonic somatic depolarization is partially transmitted to synaptic terminals, where it enhances transmitter release. It is not known to what extent such "analog signaling" applies to other mammalian neurons, and available evidence concerning underlying mechanisms is fragmentary and partially controversial. In this work, we investigate the presence of analog signaling in molecular layer interneurons of the rat cerebellum. GABA release was estimated by measuring autoreceptor currents in single recordings, or postsynaptic currents in paired recordings of synaptically connected neurons. We find with both assays that moderate subthreshold somatic depolarization results in enhanced GABA release. In addition, changes in the calcium concentration were investigated in the axon compartment using the calcium-sensitive dye OGB-1 (Oregon Green BAPTA-1). After a step somatic depolarization, the axonal calcium concentration and the GABA release probability rise with a common slow time course. However, the amount of calcium entry that is associated to one action potential is not affected. The slow increase in calcium concentration is inhibited by the P/Q calcium channel blocker ω-agatoxin-IVA. The protein kinase C inhibitor Ro 31-8220 (3-[3-[2,5-dihydro-4-(1-methyl-1H-indol-3-yl)-2,5-dioxo-1H-pyrrol-3-yl]-1H-indol-1-yl]propyl carbamimidothioic acid ester mesylate) did not affect the calcium concentration changes but it blocked the increase in GABA release. EGTA was a weak blocker of analog signaling, implicating a close association of protein kinase C to the site of calcium entry. We conclude that analog signaling is prominent in cerebellar interneurons and that it is triggered by a pathway involving activation of axonal P/Q channels, followed by calcium entry and local activation of protein kinase C.


Figures
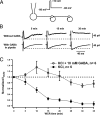
Figure 1.
Figure 1.
Autoreceptor current rundown can be slowed down by addition of intracellular GABA. A, Experimental design of autoreceptor current measurements. The cell and axon are filled with a high Cl solution. After a short depolarizing pulse to +10 mV, the autoreceptor current is measured under voltage clamp at −60 mV. B, Autoreceptor current measured in two cells at 5, 15, and 30 min after break-in. The cell shown in the top sequence was dialyzed with an intracellular solution lacking GABA, whereas that in the bottom sequence was dialyzed with an intracellular solution containing 10 mm GABA. Note the more rapid autoreceptor current amplitude decrease in the top sequence than in the bottom sequence. C, Summary results for experiments as in B. Autoreceptor currents were measured as a function of time in whole-cell recording either with (open symbols) or without (closed symbols) 10 mm GABA in the pipette solution. Data (mean ± SEM; n = 6 cells) are normalized to the amplitude registered during the first minute of whole-cell recording.
Figure 2.
Figure 2.
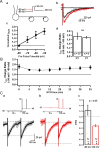
Autoreceptor current as a function of prepulse potential. A, Selecting a depolarized prepulse potential increases the autoreceptor current. Aa, Schematic of the experimental design. Ab, Examples of individual traces (in gray and pink) and average traces (black and red; averages of 6 individual traces) for prepulse potential values of −80 mV (gray and black) and −50 mV (pink and red). Ac, Normalized variation of the autoreceptor current integral as a function of prepulse potential (means ± SEM from 27 experiments) can be fitted with a straight line (black). Ad, Summary data comparing the autoreceptor current integral ratio (for prepulse potentials of −80 and −50 mV) at room temperature and at near-physiological temperature. B, Plot of the normalized response (−50 mV/−80 mV ratio) as a function of time in whole-cell recording, demonstrating the stability of this parameter in whole-cell recording conditions. Means ± SEM from six experiments are shown. (Several symbols are larger than the corresponding error bars.) C, Alteration of the paired-pulse ratio as a function of prepulse potential. Ca, Cb, Modification of the experimental protocol to examine the effect of prepulse potential on the paired-pulse ratio. Note that, in the example shown, the paired-pulse ratio is >1 for a prepulse potential of −80 mV (Ca) (average of 6 traces) and is <1 for a prepulse potential of −50 mV (Cb) (average of 6 traces). Cc, Summary data for 17 experiments as in Ca and Cb.
Figure 3.
Figure 3.
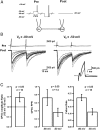
Presynaptic depolarization increases postsynaptic current in paired recordings. A, Paired recordings of synaptically connected MLIs were alternatively submitted to the two illustrated voltage protocols. In one protocol, the presynaptic MLI was held at −80 mV and pairs of pulses to +10 mV were applied. In the other protocol, the presynaptic holding potential was depolarized to −50 mV. In both protocols, the postsynaptic cell was held at −60 mV. B, Presynaptic and postsynaptic traces obtained from one paired recording. Both single sweep data (gray traces) and average data (black traces) are shown. On the postsynaptic side, there is a substantial increase in the average response to the first stimulus and a small increase in the response to the second stimulus, so that the paired-pulse ratio is decreased. Inset, Superimposed traces of presynaptic voltage-dependent currents show a decreased outward current when setting Vh at −50 mV (gray trace) compared with that obtained with Vh at −80 mV (black trace), presumably because of increased inactivation of K+ channels. C, Summary data for a total of 15 experiments as in B (left, −80 mV/−50 mV ratio; center, paired-pulse ratio; right, failure rate). Statistical tests: one-sample t test versus 1 (left); paired t test (center and right). Error bars indicate SEM.
Figure 4.
Figure 4.
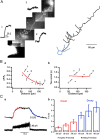
Axonal Ca2+ concentration changes in response to somatic depolarization. A, Left, Axonal Ca2+ concentration changes in three different axonal sites of a stellate cell in response to a step somatic depolarization from −60 to −40 mV. Note the gradual attenuation of the axonal response as a function of distance from the soma. Right, Morphological reconstruction of the somatodendritic (blue) and axonal (black) domains of the cell. Ba, Amplitude of the relative axonal Ca2+ concentration changes as a function of distance from the soma. The point at 0 distance corresponds to somatic measurements, which had a very weak response (ΔF/F0 of 0.0016). Axonal data have not been analyzed for points close to the soma because of the contamination of the fluorescence signal by somatic signal (flare). The amplitude versus distance relationship has been fitted with an exponential having a length constant of 71 μm (red curve). Bb, Onset kinetics of the Ca2+ concentration changes was approximated with monoexponential curves. The time constant of these curves was close to 1 s and was independent of the location along the axon. Numbers 1–3 indicate ROIs identified in A. The red line is a linear fit to the data points. Ca, Example of on and off relaxations in response to a depolarizing step from −60 to −40 mV. Red and blue lines, Exponential fits to the data (time constants: −40 mV, 1.08 s; −60 mV, 2.98 s). Cb, Average time constants of such relaxations (data collected in the presence of tetrodotoxin). The IS used for the experiments shown in this figure did not contain Alexa (see Materials and Methods). Error bars indicate SEM.
Figure 5.
Figure 5.
Simultaneous measurements of GABA release and of axonal calcium concentration during analog signaling. A, Experimental protocol and data from an exemplary cell. Aa, Section of the axon showing an increase in Ca2+-sensitive fluorescence on somatic depolarization (from −60 to −40 mV). Ab, Axonal Ca2+ signals in response to step subthreshold depolarizations (to −40 mV) of increasing durations, followed by a short superthreshold step. An exponential fit to the rise of the fluorescence trace is shown for the last panel (black curve; time constant, 2.0 s). Ac, Autoreceptor currents obtained in the same cell, in response to the test step. These currents increase in size as a function of the duration of the subthreshold depolarization. B, The increases in axonal concentration and in autoreceptor current amplitude follow the same time course. Average normalized Ca2+ concentration and autoreceptor amplitude data from eight cells as in A have been fitted with exponentials displaying a time constant of 1.20 s (Ba) and 1.26 s (Bb), respectively. C, Subthreshold depolarization does not alter the amplitude of subsequent test depolarizations. Ca, Peak fluorescence amplitude minus holding potential value increases on insertion of a depolarizing prepulse (paired t test, p < 0.05), but measurements of the peak amplitude from the prepulse baseline do not reveal any significant change (paired t test, p > 0.05), indicating that the prepulse does not alter the amount of Ca2+ entry elicited by the test pulse. Cb, Fluorescence values measured at rest (AP number, 0) and at the peak of the response to one, two, or four action potentials, both in control conditions (in black) and after a depolarizing prepulse to −40 mV (in blue). Here, absolute fluorescence values are shown rather than the ΔF/F0 quantification used elsewhere in this paper. The data have been normalized with respect to the peak response to four action potentials without prepulse. They have been fitted using a common hyperbolic function with an asymptote of 2.7 and a half-saturation value of 10 [fitting function: y = 2.7/(1 + 10 (x + b)), with b = 1.9 without prepulse and b = 3.8 with prepulse]. The IS used for the experiments shown in this figure contained Alexa. Error bars indicate SEM.
Figure 6.
Figure 6.
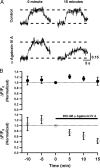
Sensitivity of axonal Ca2+ concentration changes to ω-agatoxin-IVA. A, Example recordings showing a stable Ca2+ concentration response to a step somatic depolarization (from −60 to −40 mV; top row) and, in another cell, the inhibition of a similar response after 15 min of bath perfusion with the P/Q channel blocker ω-agatoxin-IVA (bottom row). B, Summary plot comparing the time course of the axonal Ca2+ concentration response in control experiments, in which no change was made to the bath (closed symbols), and in test experiments, in which the toxin was added to the bath. The IS used for the experiments shown in this figure contained Alexa. Error bars indicate SEM.
Figure 7.
Figure 7.
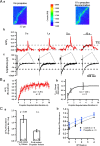
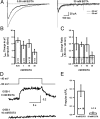
Sensitivity of analog signaling to intracellular Ca2+ buffers. A, Recordings from two experiments showing a large increase in autoreceptor current with 0.05 mm intracellular EGTA (left), but not with 30 mm EGTA (right), on changing the prepulse potential from −80 to −50 mV. B, Average data showing the sensitivity of the mean autoreceptor current charge at a fixed prepulse potential (−80 mV) as a function of EGTA concentration. Note the weak potency of EGTA as a blocker of exocytosis. Even at 30 mm, the reduction of the autoreceptor amplitude with respect to the control data (50 μm EGTA) was not statistically significant. C, Average data from experiments as in A, showing significant (p < 0.05) increases in autoreceptor current amplitude on prepulse depolarization with 0.05, 1, or 10 mm EGTA, but not with 30 mm EGTA. D, Fluorescence axonal responses to depolarizing voltage pulses without or with 10 mm EGTA, showing that EGTA abolishes the voltage dependence of the OGB-1 signal. E, Summary data of the EGTA experiments. Error bars indicate SEM.
Figure 8.
Figure 8.
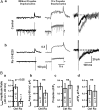
A PKC blocker abolishes analog signaling. A, Selective abolition of analog signaling by Ro 31-8220. Aa, Data from a control experiment without Ro 31-8220. Left column (in black), Axonal OGB-1 signal (top trace) and corresponding cellular current during a control run consisting of a step depolarization at the end of a holding period at −60 mV. Middle column (in gray), Axonal OGB-1 signal and corresponding cellular current when including a depolarizing prepulse to −40 mV before the test pulse. Right column, Superimposed autoreceptor current responses showing potentiation of the autoreceptor current at the end of the depolarizing prepulse (gray trace) compared with the control (black trace). Ab, Similar data as in Aa, taken from a cell incubated in the presence of the PKC blocker Ro 31-8220 (3 μm). Note that the depolarization to −40 mV still induces an increase in the axonal Ca2+ concentration but fails to induce any potentiation of the autoreceptor current. Scale bars are common to Aa and Ab. B, Summary data showing that Ro 31-8220 abolishes the effects of depolarizing prepulse (from −60 to −40 mV) on autoreceptor current amplitude (Ba) but fails to change the size of the autoreceptor current measured at −60 mV (Bb) or to alter the increase in axonal Ca2+ concentration in response to subthreshold somatic depolarization (Bc) (from −60 to −40 mV) or to suprathreshold depolarization (Bd) (steps from −60 mV to +10 mV; no prepulse). Statistical tests were as follows: Ba, one-sample t test versus 1 (p < 0.05 in control, and p > 0.05 in the presence of Ro 31-8220); Bb–Bd, paired t test. The IS used for the experiments shown in this figure did not contain Alexa. Error bars indicate SEM.

References

    1. Alle H, Geiger JR. Combined analog and action potential coding in hippocampal mossy fibers. Science. 2006;311:1290–1293. - PubMed
    1. Alle H, Geiger JR. GABAergic spill-over transmission onto hippocampal mossy fiber boutons. J Neurosci. 2007;27:942–950. - PMC - PubMed
    1. Alle H, Geiger JR. Analog signalling in mammalian cortical axons. Curr Opin Neurobiol. 2008;18:314–320. - PubMed
    1. Awatramani GB, Price GD, Trussell LO. Modulation of transmitter release by presynaptic resting potential and background calcium levels. Neuron. 2005;48:109–121. - PubMed
    1. Brager DH, Cai X, Thompson SM. Activity-dependent activation of presynaptic protein kinase C mediates post-tetanic potentiation. Nat Neurosci. 2003;6:551–552. - PubMed

Publication types

MeSH terms