. 2011 Apr 13;31(15):5829-40.
doi: 10.1523/JNEUROSCI.6363-10.2011.

Mixed mode oscillations in mouse spinal motoneurons arise from a low excitability state

Affiliations

Mixed mode oscillations in mouse spinal motoneurons arise from a low excitability state

Caroline Iglesias et al. J Neurosci. .

Abstract

We explain the mechanism that elicits the mixed mode oscillations (MMOs) and the subprimary firing range that we recently discovered in mouse spinal motoneurons. In this firing regime, high-frequency subthreshold oscillations appear a few millivolts below the spike voltage threshold and precede the firing of a full blown spike. By combining intracellular recordings in vivo (including dynamic clamp experiments) in mouse spinal motoneurons and modeling, we show that the subthreshold oscillations are due to the spike currents and that MMOs appear each time the membrane is in a low excitability state. Slow kinetic processes largely contribute to this low excitability. The clockwise hysteresis in the I-F relationship, frequently observed in mouse motoneurons, is mainly due to a substantial slow inactivation of the sodium current. As a consequence, less sodium current is available for spiking. This explains why a large subprimary range with numerous oscillations is present in motoneurons displaying a clockwise hysteresis. In motoneurons whose I-F curve exhibits a counterclockwise hysteresis, it is likely that the slow inactivation operates on a shorter time scale and is substantially reduced by the de-inactivating effect of the afterhyperpolarization (AHP) current, thus resulting in a more excitable state. This accounts for the short subprimary firing range with only a few MMOs seen in these motoneurons. Our study reveals a new role for the AHP current that sets the membrane excitability level by counteracting the slow inactivation of the sodium current and allows or precludes the appearance of MMOs.


Figures

Figure 1.
Figure 1.
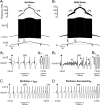
Most motoneurons respond to a slow triangular current ramps with a discharge displaying MMOs and a clockwise hysteresis. A, Response to a 1 nA/s triangular ramp of current (15 nA amplitude). Instantaneous firing frequency (top trace), voltage response (middle trace), and injected current (bottom trace) are shown. The resting potential was −74 mV and the voltage threshold for the first spike (−64 mV) was reached when the current intensity was 8.3 nA (recruitment current, arrow below the ascending current ramp and lower dashed line). Note the decrease in spike amplitude during the ascending ramp and its stabilization at a low level during the descending ramp. The derecruitment current on the descending ramp was 10.8 nA, i.e., larger than the recruitment current (arrow on descending ramp and upper dashed line). B1, Magnification of the voltage trace near recruitment. The asterisk indicates the first spike on the ascending ramp. Spikes have been truncated to better see the voltage oscillations (some of them indicated by arrowheads) that appear in the interspike intervals after the AHP has fully relaxed. Note the firing variability that characterizes the subprimary range (SPR). B2, Increasing the injected current resulted in a primary firing range (PR) without oscillation between spikes and with less variability. B3, Magnification of the voltage trace near the derecruitment current. Firing becomes irregular again, and subthreshold oscillations reappear between spikes. B4, I–F relationship. Black and gray dots indicate the instantaneous frequency of each spike during the ascending and descending ramps, respectively. Note the clockwise hysteresis of the I–F relationship. The transition from the SPR to the PR occurred at 9.8 nA on the ascending ramp (dashed line). The input resistance of this motoneuron was 2.1 MΩ.
Figure 2.
Figure 2.
The discharge of a minority of motoneurons displays a counterclockwise hysteresis. A, Response of another motoneuron to a 1 nA/s triangular ramp of current (6.8 nA amplitude). Same arrangement as in Figure 1A. The resting potential was −76 mV and the voltage threshold for the first spike (−53 mV) was reached for a current intensity of 3.4 nA (recruitment current). Note that spike amplitude decreased much less during the ascending ramp than in Figure 1. The derecruitment current on the descending ramp was 2.4 nA, i.e., smaller than the recruitment current. B1, Magnification of the voltage trace near recruitment (truncated spikes). Voltage oscillations (arrowhead) appear before the first spike (asterisk) and remain present in the first few interspike intervals, giving rise to a small subprimary range (SPR). B2, Magnification of the voltage trace near the derecruitment current. B3, I–F relationship. Note the counterclockwise hysteresis. The transition from SPR to primary firing range (PR) occurred at 3.7 nA (dashed line). Note that a few subthreshold oscillations reappear. The input resistance of this motoneuron was 5.3 MΩ.
Figure 3.
Figure 3.
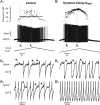
MMOs and a subprimary firing range occur in the basic model. A1, Response of the model to a triangular current ramp (0.5 nA/s, 10 nA amplitude). Same arrangement as in Figure 1A. The dashed vertical lines indicate the transitions from subprimary range (SPR) to primary firing range (PR) on the ascending ramp (SPR width 2.9 nA) and from PR to SPR on the descending ramp. A2, Magnification of the voltage trace at firing onset (truncated spikes). Note that subthreshold oscillations (black arrowhead) appear before the first action potential (asterisk, recruitment current 4.4 nA). The open arrowhead points out to the voltage plateau that follows the AHP relaxation. A3, Magnification at the transition from the SPR to the PR (7.3 nA). Note that the time scale is three times faster than in A2. The oscillations (black arrowhead) totally disappear after the transition. B1, Same as in A1 with white noise added to the injected current. B2, B3, Magnification of the voltage trace at the firing onset (B2) and at the transition from the SPR to PR (B3). Note the fluctuations of the voltage and the substantial variations of interspike intervals in the SPR (B2). Subthreshold oscillations (black arrowhead) follow the AHP decay and progressively disappear during the SPR (B2). Recruitment current is 3.8 nA and transition from SPR to PR (dashed line) occurs at 7.6 nA. The SPR width is increased to 3.8 nA compared with A. C, Same as in A (no noise) except that a persistent component was added to the sodium current (INap; conductance 0.5 μS). Magnification of the voltage response near firing onset. The recruitment current is 3.4 nA, i.e., smaller than in A, indicating an increased excitability. The transition from the SPR to the PR occurs at 3.8 nA. The width of the SPR is thus 0.4 nA, i.e., much smaller than in A. D, Same as in A except for the conductance of the delayed rectifier current (GK), which was reduced to 3 μS (instead of 3.5 μS in A). Magnification of the voltage response near firing onset. The recruitment current is 3.0 nA, and the current at the transition from the SPR to the PR (dashed line) is 3.5 nA. Therefore, the width of the SPR is 0.5 nA, again much smaller than in A.
Figure 4.
Figure 4.
Adding an artificial persistent sodium current with dynamic clamp creates a primary firing range (PR) and decreases the subprimary range (SPR) in a real motoneuron. A1, Response of the motoneuron to a slow ramp of current (9 nA amplitude, 1 nA/s, control condition without dynamic clamp). The recruitment current was 3.5 nA. The discharge remained in the SPR during the whole ramp. Note the great variability in the frequencygram. A2, A3, Magnifications of the voltage trace (between the two pairs of dashed vertical lines in A1, truncated spikes) showing the fast oscillations (arrowheads), which account for the variability of the interspike intervals. B1, Response of the motoneuron in dynamic clamp (7 nA amplitude, 1 nA/s, artificial GNap = 0.025 μS). The recruitment current was reduced to 1.6 nA, indicating an increased excitability when the artificial persistent current was added. A firing range with little variability appeared in the frequencygram. B2, Magnification of the voltage trace at the beginning of the ramp (between the two dashed vertical lines in B1) showing the fast oscillations (arrowheads). B3, Magnification of the voltage trace for a higher current intensity (between the second pair of dashed lines in B1) showed no oscillations, as expected in the PR. A PR was thus created at the expense of the SPR, whose width decreased. This PR was observed despite the smaller ramp amplitude compared with control. It was entirely due to the addition of the artificial persistent sodium current. The input resistance of this motoneuron was 1.4 MΩ.
Figure 5.
Figure 5.
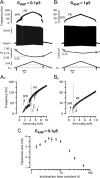
Adding a slow sodium current inactivation to the model creates a clockwise hysteresis. The transient sodium current was endowed with a slow inactivation process (3 s time constant) that added to the fast inactivation (1 ms) already present. The subsequent reduction in excitability was compensated by introducing a persistent sodium current (conductance 2.5 μS) with similar slow inactivaction. A1, Response to a slow triangular ramp of current (0.5 nA/s, amplitude 10 nA) when the AHP conductance was set to 0.1 μS. From top to bottom: instantaneous firing frequency, voltage response, slow inactivation variable (hs, see Materials and Methods) and injected current. Note the reduction of the spike amplitude during the ascending ramp. The gray dots on the inactivation curve point to the inactivation at firing recruitment on the ascending ramp and derecruitment on the descending ramp. PR, Primary firing range; SPR, subprimary firing range. A2, I–F curve. Note the large clockwise hysteresis of the I–F relationship. B1, B2, Response when the AHP conductance was increased 10 times (to 1 μS). Same arrangement as in A1 and A2. Note that the spike amplitude decreases much less, there is less slow inactivation, the subprimary range is narrower, and the hysteresis has almost vanished. C, Size of the hysteresis (i.e., difference between derecruitment and recruitment currents) plotted against the time constant of slow inactivation of the sodium current. The AHP conductance was 0.1 μS. Each point is the average of five simulations, and the vertical bar on each point is the SD. The abscissa is in logarithmic scale.
Figure 6.
Figure 6.
Increasing the AHP reduces both the MMOs and the clockwise hysteresis in a real motoneuron. A1, Response to a slow triangular ramp of current (0.1 nA/s, 6.7 nA amplitude). Same arrangement as in Figures 1A, 2A. Note the substantial decrease of spike amplitude during the ascending ramp. The discharge was asymmetric, the derecruitment current being larger (3.8 nA) than the recruitment current (2.4 nA), i.e., the I–F relationship displayed a clockwise hysteresis (data not shown). A2, Magnification of the voltage (truncated spikes) showing the fast subthreshold oscillations and the irregularity of the discharge. B1, Response when an artificial AHP (conductance 0.4 μS) was added to the natural one using dynamic clamp. Note that the spike amplitude remained nearly constant throughout the ramp and that the clockwise hysteresis disappeared (equal recruitment and derecruitment currents). B2, Magnification of the voltage trace showing that the subthreshold oscillations were much reduced compared with the large oscillations observed without the artificial AHP. Moreover the discharge became much more regular. The input resistance of this motoneuron was 5.0 MΩ.
Figure 7.
Figure 7.
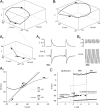
Counterclockwise hysteresis in the model. A, The time constant of the slow inactivation of the sodium current was reduced to 0.6 s and the AHP conductance set to 0.1 μS. Top, Voltage response; middle, slow inactivation variable; bottom, injected current. A few spikes only were emitted and they were followed by sustained fast oscillations as shown on the enlargement of the circled area. B1, The AHP conductance was increased to 1 μS. Same arrangement as in Figure 7A1. Note that there is less slow inactivation than in A and that the discharge is sustained. The gray dots on the inactivation curve indicate the values of hs at recruitment and derecruitment. B2, I–F curve. Note the counterclockwise hysteresis. B3, Magnification of the voltage response at the transition from the subprimary range (SPR) to the primary firing range (PR).
Figure 8.
Figure 8.
The Shilnikov's homoclinic bifurcation scenario. A1, Trajectory of the reduced model during a typical period in the subprimary range (SPR). The trajectory [V(t), W(t), z(t)] is plotted in the three-dimensional V, W, z space. V is the voltage, W the recovery variable (see Materials and Methods), and z the activation variable of the AHP conductance. The arrows show motion direction on the three-dimensional trajectory. A2, Magnification of the trajectory (box in A1) when it revisits the unstable focus on the V, W plane. Note the spiral made by the trajectory around this focus. A3, Time evolution of the voltage (bottom trace) and of the AHP activation (z, top trace). Note the MMOs on the voltage. Note also that z fully relaxes to 0 during the interspike interval well before the next spike is fired. A4, The two nullclines dV/dt = 0 (dashed line) and dW/dt = 0 (gray line) are drawn in the V, W plane (i.e., the z = 0 plane). The trajectory spirals around the intersection of the two nullclines, i.e., the fixed point of the model. B1, Typical trajectory of the model in the primary firing range (PR). The trajectory stays away from the V, W plane where the unstable fixed point is located. B2, Time evolution of the voltage and z. Given the high discharge frequency, z has no time to relax between spikes. C, Bifurcation diagram of the model: the voltage of the stationary solution, both stable and unstable, is displayed as a function of the injected current. In the quiescent regime, the model displays a stable fixed point (solid line). This fixed point becomes unstable at 4.1 nA (first vertical line) through a subcritical Hopf bifurcation (HB) when it merges with an unstable, and thus not experimentally observable, periodic solution (thin dashed line). The model then displays MMOs with an alternation of subthreshold oscillations (the dots near the unstable fixed point indicate their minimum and maximum voltage) and full blown spikes (the series of upper and lower dots show their minimum and maximum voltage). The variations in the peak amplitude of spikes correspond to the successive frequency plateaus in the SPR. At 7.3 nA (second vertical line), the subthreshold oscillations and the unstable periodic solution disappear, and the model enters the PR.

Similar articles

Cited by

References

    1. Abbot LF, Kepler T. Model neurons: from Hodgkin-Huxley to Hopfield. In: Garrido L, editor. Statistical mechanics of neural networks. Berlin: Springer; 1990. pp. 5–18.
    1. Alaburda A, Perrier JF, Hounsgaard J. An M-like outward current regulates the excitability of spinal motoneurones in the adult turtle. J Physiol. 2002;540:875–881. - PMC - PubMed
    1. Alonso A, Klink R. Differential electroresponsiveness of stellate and pyramidal-like cells of medial entorhinal cortex layer II. J Neurophysiol. 1993;70:128–143. - PubMed
    1. Bennett DJ, Li Y, Siu M. Plateau potentials in sacrocaudal motoneurons of chronic spinal rats, recorded in vitro. J Neurophysiol. 2001;86:1955–1971. - PubMed
    1. Boehmer G, Greffrath W, Martin E, Hermann S. Subthreshold oscillation of the membrane potential in magnocellular neurones of the rat supraoptic nucleus. J Physiol. 2000;526:115–128. - PMC - PubMed

Publication types

Substances