. 2011 Jun;105(6):2920-30.
doi: 10.1152/jn.00684.2010. Epub 2011 Apr 13.

Short-term modulation at synapses between neurons in laminae II-V of the rodent spinal dorsal horn

Affiliations

Short-term modulation at synapses between neurons in laminae II-V of the rodent spinal dorsal horn

W Zhang et al. J Neurophysiol. 2011 Jun.

Abstract

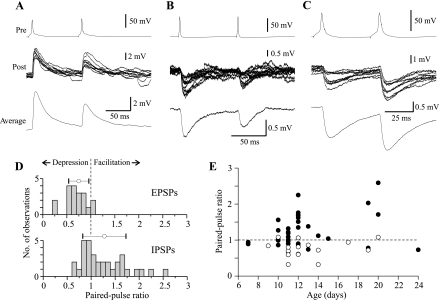
Unitary excitatory (EPSP) and inhibitory (IPSP) postsynaptic potentials (PSPs) were evoked between neurons in Rexed's laminae (L)II-V of spinal slices from young hamsters (7-24 days old) at 27°C using paired whole cell recordings. Laminar differences in synaptic efficacy were observed: excitatory connections were more secure than inhibitory connections in LII and inhibitory linkages in LII were less reliable than those in LIII-V. A majority of connections displayed paired-pulse facilitation or depression. Depression was observed for both EPSPs and IPSPs, but facilitation was seen almost exclusively for IPSPs. There were no frequency-dependent shifts between facilitation and depression. Synaptic depression was associated with an increased failure rate and decreased PSP half-width for a majority of connections. However, there were no consistent changes in failure rate or PSP time course at facilitating connections. IPSPs evoked at high-failure synapses had consistently smaller amplitude and showed greater facilitation than low-failure connections. Facilitation at inhibitory connections was positively correlated with synaptic jitter and associated with a decrease in latency. At many connections, the paired-pulse ratio varied from trial to trial and depended on the amplitude of the first PSP; dependence was greater for inhibitory synapses than excitatory synapses. Paired-pulse ratios for connections onto neurons with rapidly adapting, "phasic" discharge to depolarizing current injection were significantly greater than for connections onto neurons with tonic discharge properties. These results are evidence of diversity in synaptic transmission between dorsal horn neurons, the nature of which may depend on the types of linkage, laminar location, and intrinsic firing properties of postsynaptic cells.


Figures

Fig. 1.
Fig. 1.
Synaptic transmission between pairs of dorsal horn neurons. A and B: current-clamp recordings from presynaptic (Pre) and postsynaptic (Post) cells. Arrows indicate action potentials triggered by brief depolarizing current pulses applied to the presynaptic neuron. A: excitatory postsynaptic potentials (EPSPs) activated at an excitatory linkage [5 traces; membrane voltage (Vm) of the postsynaptic neuron: −53 mV]. Inset: dual whole cell recording configuration used in the experiments. B: inhibitory postsynaptic postentials (IPSPs) activated at an inhibitory linkage (7 traces; postsynaptic Vm: −54 mV). Arrowheads indicate the traces showing transmission failures. Bottom traces show averages of 25 successive PSPs. C: plots showing that there was no correlation between the rise time and amplitude of unitary EPSPs (r = −0.1930, P = 0.4579) and IPSPs (r = 0.1763, P = 0.3344) recorded at connections between dorsal horn neurons in this study. D: histograms comparing transmission failure for EPSPs and IPSPs recorded at 53 laminae (L)II–V connections. The dashed lines indicate the division between “low-failure” (to the left) and “high-failure” (to the right) connections (see text for details). E: photomicrograph (×20) showing two neurons in Rexed's LII (*) labeled with biocytin during a whole cell recording that exhibited an inhibitory linkage (10 days old). Neuronal somata and dendrites were thrown out of focus to highlight the fine axon branches (arrows).
Fig. 2.
Fig. 2.
Alteration of synaptic responses during repetitive activation. Trains of action potentials were evoked in the presynaptic cells by injecting current pulses at 10 Hz, and the resulting responses were recorded in the postsynaptic neuron. Traces show averages of 25 successive stimuli. A: decrease in EPSP amplitude at a connection between a LIII cell pair. B: decrease in IPSP activated between a LII cell pair. C: increase in IPSP activated between a cell pair in LII/LIII. Graphs below traces show PSP amplitude plotted against stimulus number (error bars refer to SEs). The points on the graphs were well fitted to an exponential function of the following form: y = y0 + aebx, where y0 is the y-axis intercept, a is amplitude, and b is 1/τ. For these examples, r2 = 0.99 and time constant (τ) = 313 ms in A, r2 = 0.99 and τ = 166 ms in B, r2 = 0.98 and τ = 2.6 s in C.
Fig. 3.
Fig. 3.
Paired-pulse facilitation and depression in local dorsal horn circuits. A–C: paired-pulse responses (postsynaptic cell) at three representative connections (10 traces) to impulses elicited in the presynaptic cell. Averages were constructed from 50 consecutive sweeps. Paired-pulse intervals were 100 ms for A and B and 50 ms for C. The width and timing of the presynaptic action potentials activated by the depolarizing pulses shown in A–C were comparable. A: depressing excitatory connection. B: depressing inhibitory connection. C: facilitating inhibitory connection. D: distribution of paired-pulse ratios for 19 excitatory connections and 32 inhibitory connections (100-ms intervals). Symbols above the histograms signify means ± SD. E: paired-pulse ratios for individual excitatory (○) and inhibitory (●) connections (n = 52) plotted versus the age of animals from which spinal slices were obtained. The dashed lines in D and E indicate paired-pulse ratios = 1.0.
Fig. 4.
Fig. 4.
Variation in synaptic latency for dorsal horn connections associated with short-term synaptic plasticity (○, EPSPs; ●, IPSPs) at the 100-ms interval. A: plot of the coefficient of variation (%CV) of response latency of the first PSP (synaptic jitter) as a function of the paired-pulse ratio. Data for inhibitory connections were fitted with a linear regression (r = 0.5788) with a slope that was significantly different from zero (P = 0.0006). B: plot of the change in latency (Δlatency = latencyPSP1 − latencyPSP2) as a function of the paired-pulse ratio. The regression line is for inhibitory connections (r = −0.6121, P = 0.0003). The dashed line indicates Δlatency = 0.
Fig. 5.
Fig. 5.
Plots of the paired-pulse ratio as a function of amplitude of the first PSP for synapses between dorsal horn neurons. A and B: examples from two cell pairs connected by excitatory linkages that exhibited significant synaptic depression (paired-pulse ratio < 1.0, P < 0.05). C and D: cell pairs connected by inhibitory linkages. The connection in C exhibited facilitation (paired-pulse ratio > 1.0, P < 0.05), and the connection in D showed depression. Examples are representative of the range over which amplitude of the first PSP varied for excitatory and inhibitory connections in this study. E and F: summary of paired-pulse ratios for excitatory (n = 18) and inhibitory (n = 33) connections. For each cell pair, PSP amplitudes were normalized to the largest event (maximum value set to 1.0). Paired-pulse ratios were pooled from all connections and grouped according to normalized PSP amplitude into 0.1-sized bins. Average paired-pulse ratios across cell pairs were calculated and plotted versus the normalized amplitude. Error bars indicate SEs. The interstimulus interval (100 ms) was the same for all data shown. The dashed lines indicate paired-pulse ratios = 1.0.
Fig. 6.
Fig. 6.
Time course of paired-pulse facilitation at an inhibitory linkage. A: IPSPs (Post) from a representative cell pair activated by presynaptic action potentials (Pre) at different intervals. The numbers at the top indicate the interpulse intervals. Traces are averages of 11–32 responses (●, stimulus-evoked IPSPs in longer interval traces). B: plot of the mean paired-pulse ratios computed for the intervals shown in A (*P < 0.05 and **P = 0.005, one-sample t-test). Error bars correspond to SEs.
Fig. 7.
Fig. 7.
Time course of paired-pulse depression at inhibitory (A) and excitatory (B) linkages between representative cell pairs. A1: IPSPs (Post) activated by presynaptic action potentials (Pre) at different intervals (indicated above traces). Traces are averages of 14–21 individual sweeps. A2: plot showing the paired-pulse ratio at different interpulse intervals (*P = 0.0005). B1: EPSPs activated at the test various intervals as indicated. Traces are averages of 25–50 sweeps. B2: paired-pulse ratios at different intervals (*P < 0.0001).
Fig. 8.
Fig. 8.
Comparison of paired-pulse ratios to firing pattern of postsynaptic neurons. A: voltage recordings (top three traces) showing the representative pattern of discharge for phasic and tonic firing neurons in response to depolarizing current pulses (bottom trace). Phasic neurons displayed a short, rapidly adapting discharge to constant membrane depolarization, with a duration that increased with increasing current. Tonic cells responded with sustained firing for the duration of the current pulse. The solid and open circles to the right of the first trace in A indicate the cell category from which the data plotted in B originate. B: plot of paired-pulse ratios computed at four interpulse intervals for synaptic linkages onto phasic (n = 32) and tonic (n = 11) neurons. The dashed line indicates paired-pulse ratio = 1. The bold lines superimposed on the individual plots signify the mean of the data points. The difference between mean paired-pulse ratios for phasic and tonic cells at each interpulse interval wass significant (P = 0.017, 50 ms; P = 0.02, 100 ms; P = 0.024, 250 ms; P = 0.013, 500 ms).

Similar articles

Cited by

References

    1. Angulo MC, Staiger JF, Rossier J, Audinat E. Developmental synaptic changes increase the range of integrative capabilities of an identified excitatory neocortical connection. J Neurosci 19: 1566–1576, 1999 - PMC - PubMed
    1. Angulo MC, Staiger JF, Rossier J, Audinat E. Distinct local circuits between neocortical pyramidal cells and fast-spiking interneurons in young adult rats. J Neurophysiol 89: 943–953, 2003 - PubMed
    1. Beal JA, Russell CT, Knight DS. Morphological and developmental characterization of local-circuit neurons in lamina III of the rat spinal cord. Neurosci Lett 86: 1–5, 1988 - PubMed
    1. Bicknell HR, Beal JA. Axonal and dendritic development of substantia gelatinosa neurons in the lumbosacral spinal cord of the rat. J Comp Neurol 226: 508–522, 1984 - PubMed
    1. Cabezas C, Buño W. Distinct transmitter release properties determine differences in short-term plasticity at functional and silent synapses. J Neurophysiol 95: 3024–3034, 2006 - PubMed

Publication types

MeSH terms

LinkOut - more resources