. 2011 May;121(5):1946-55.
doi: 10.1172/JCI44447. Epub 2011 Apr 1.

The majority of intestinal IgA+ and IgG+ plasmablasts in the human gut are antigen-specific

Affiliations

The majority of intestinal IgA+ and IgG+ plasmablasts in the human gut are antigen-specific

Julia Benckert et al. J Clin Invest. 2011 May.

Abstract

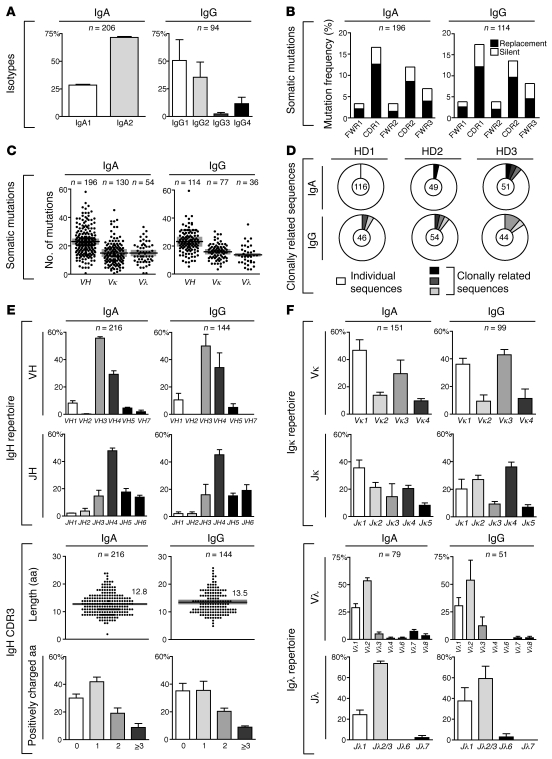
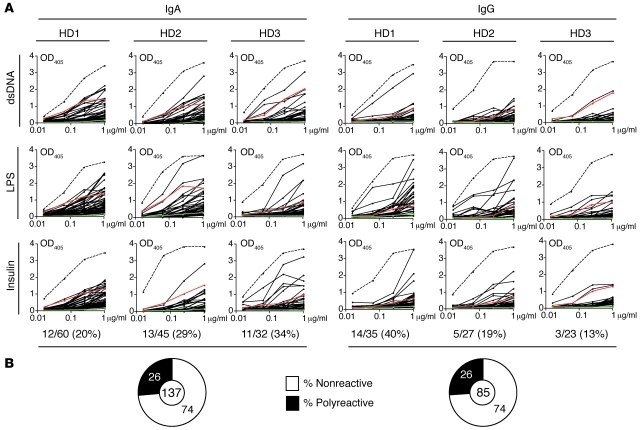
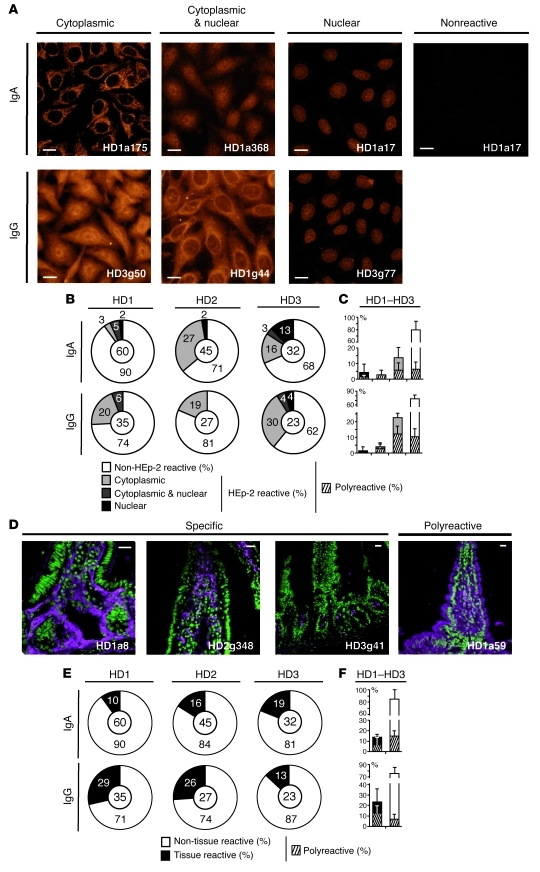
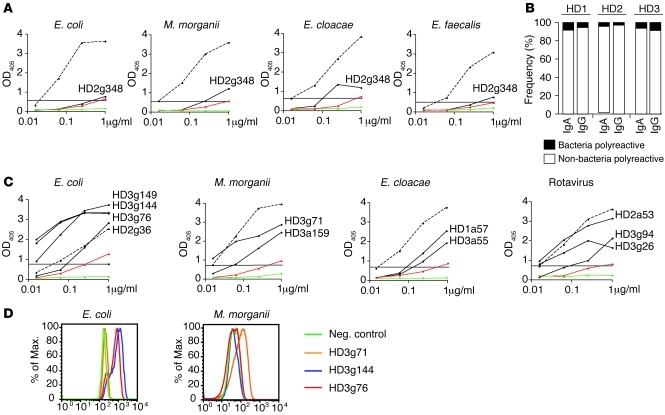
Mucosal antibody responses play a major role in mediating homeostasis with the intestinal flora. It has been suggested that imbalance in the IgA+ and IgG+ intestinal B cell repertoire may be associated with the development of diseases such as inflammatory bowel disease. Despite this, little is known about the antibody specificity of human intestinal plasmablasts. Here, we have determined the reactivity profile of single isolated IgA+ and IgG+ plasmablasts from human terminal ileum using antibody cloning and in vitro expression. We found that approximately 25% of intestinal IgA and IgG plasmablast antibodies were polyreactive; the majority were antigen-specific. Antigen specificity was not only directed against enteropathogenic microbes but also against commensal microbes and self antigens. Regardless of their reactivity, all intestinal antibodies were somatically mutated and showed signs of antigen-mediated selection, suggesting that they developed from antigen-specific B cell responses. Together, our data indicate that antigen-specific immune responses to intestinal microbes are largely responsible for the maintenance of intestinal homeostasis and thus provide a basis for understanding the deregulated immune responses observed in patients with inflammatory bowel disease.


Figures

Figure 1
Figure 1. Ig gene analysis of intestinal IgA+ and IgG+ plasmablasts.
The IGH gene sequences of IgA+ and IgG+ plasmablasts from the terminal ileum of HD1–HD3 were analyzed for (A) isotype subclass usage, (B) frequency of replacement (black) and silent (white) mutations in FWRs and CDRs, (C) absolute number of somatic mutations in V genes, (D) clonal relationships, (E) IGH V family and J gene usage and IgH CDR3 aa length and positive charges, and (F) IGK and IGL V family and J gene usage. The absolute number of sequences analyzed is indicated over each graph. Error bars in bar graphs indicate standard deviation of means for individual patients. Average means of IgH CDR3 length and of V gene somatic mutations are indicated by horizontal lines in the respective graphs. Gray bars indicate standard deviation of means of individual donors (each donor is indicated by an individual symbol). The number of tested antibodies is indicated in the pie chart center. Shaded areas in pie charts indicate clonally related sequences. P values were calculated to compare data from IgA and IgG plasmablasts but did not reach values below 0.05 and thus are not indicated.
Figure 2
Figure 2. Polyreactivity of intestinal IgA and IgG plasmablast antibodies.
IgA and IgG plasma cell antibodies from HD1–HD3 (solid lines) were tested for polyreactivity with dsDNA, ssDNA, insulin, and LPS by ELISA in at least 3 independent experiments. (A) Representative graphs for dsDNA, LPS, and insulin are shown. Dotted lines represent the high positive control antibody ED38 (40). Red and green lines show the low positive control antibody JB40 and the negative control antibody mGO53, respectively (23). The number and frequency of polyreactive antibodies with reactivity to at least 2 structurally different antigens out of all tested IgA and IgG antibodies is indicated below the respective graphs for each donor (23, 24). (B) Pie charts summarize the frequency of nonpolyreactive (white) and polyreactive (black) antibodies out of all tested IgA and IgG antibodies from all donors as measured in 3 independent experiments. The number of tested antibodies is indicated in the pie chart center. Other numbers in pie charts represent the frequency of polyreactive and nonpolyreactive antibodies, respectively.
Figure 3
Figure 3. Self-reactivity of IgA and IgG lamina propria plasmablasts.
IgA and IgG plasma cell antibodies from HD1–HD3 were tested for self-reactivity (AC) by IFA with HEp-2 cells and (DF) on intestinal tissue sections. (A) Representative cytoplasmic, cytoplasmic and nuclear, and nuclear HEp-2 cell staining patterns. A non-HEp-2 cell–reactive antibody is shown for comparison. Scale bars: 20 μm. (B) Pie charts summarize the frequency of non-HEp-2 cell–reactive (white) and HEp-2 cell–reactive antibodies, with cytoplasmic (light gray), cytoplasmic and nuclear (dark gray), and nuclear (black) reactivity. The number of tested antibodies is indicated in the pie chart center. Other numbers in each section represent the frequency of antibodies for each condition, respectively. (C) Bar graphs summarize the frequency of antinuclear (black), anticytoplasmic and antinuclear (dark gray), anticytoplasmic (light gray), and non-self-reactive (white) antibodies for HD1–HD3. Hatched areas indicate polyreactive antibodies. Standard deviation of means is indicated. (D) Representative specific and polyreactive intestinal tissue staining patterns (purple). Hoechst-stained nuclei are shown in green. Scale bars: 50 μm. (E) Pie charts show the frequency of non-intestinal tissue–reactive antibodies (white) and intestinal tissue–reactive antibodies (black) for each HD. The number of tested antibodies is indicated in the pie chart center. Other numbers in each section represent the frequency of antibodies for each condition, respectively. (F) Bar graphs summarize the frequency of tissue reactive (black) and non-tissue reactive (white) IgA and IgG antibodies, respectively, for HD1–HD3. Hatched areas indicate polyreactive antibodies. Standard deviation of means is indicated.
Figure 4
Figure 4. Reactivity of IgA and IgG lamina propria plasmablast antibodies with intestinal microbes.
IgA and IgG plasma cell antibodies from HD1–HD3 were tested for reactivity with a panel of nonpathogenic and enteropathogenic intestinal microbes. The data shown are representative for at least 2 independent experiments. (A) ELISA graphs show the reactivity profile (black line) of a representative bacteria-polyreactive antibody (HD2g348) with E. coli, M. morganii, E. cloacae, and E. faecalis. High positive (dashed line, ED38; ref. 40), low positive (red line, JB40; ref. 23), and nonreactive (green line, mGO53; ref. 23) antibodies were included in each assay for comparison. Horizontal lines indicate the cutoff OD405 in each assay. (B) Bar graphs summarize the frequency of bacteria polyreactive antibodies (black) and non-bacteria polyreactive IgA and IgG antibodies (white) in each donor as determined by ELISA as in A. (C) Representative ELISA graphs show the reactivity of E. coli, M. morganii, E. cloacae, and rotavirus-specific IgA and IgG plasma cell antibodies from HD1–HD3. Clone names of bacteria-specific antibodies are indicated in the graphs. Additional high positive (dashed line, ED38; ref. 40), low positive (red line, JB40; ref. 23) and nonreactive (green line, mGO53; ref. 23) control antibodies were included in each assay for comparison. Horizontal lines indicate the cutoff OD405 in each assay. (D) Histograms show binding of E. coli–specific (HD3g76, HD3g144) and M. morganii–specific (HD3g71) antibodies to whole bacteria as measured by FACS. Secondary antibody only (neg. control) was included as control in all assays.
Figure 5
Figure 5. Antibody reactivity of human IgA+ and IgG+ lamina propria plasmablasts.
Pie charts summarize the frequency of IgA+ and IgG+ plasmablasts of unknown specificity (white), of plasmablasts with specificity for intestinal microbes (blue, E. coli; yellow, M. morganii; red, E. cloacae; green, rotavirus) or self antigens (light gray, HEp-2 or intestinal tissue), and of unspecific bacteria-reactive (hatched dark gray) and polyreactive (black) plasmablasts as percentages of all tested IgA and IgG antibodies, respectively, from HD1–HD3. The number of tested antibodies is indicated in the pie chart centers.

References

    1. Brandtzaeg P, Johansen FE. Mucosal B cells: phenotypic characteristics, transcriptional regulation, and homing properties. Immunol Rev. 2005;206:32–63. doi: 10.1111/j.0105-2896.2005.00283.x. - DOI - PubMed
    1. Brandtzaeg P, Prydz H. Direct evidence for an integrated function of J chain and secretory component in epithelial transport of immunoglobulins. Nature. 1984;311(5981):71–73. doi: 10.1038/311071a0. - DOI - PubMed
    1. Shroff KE, Cebra JJ. Development of mucosal humoral immune responses in germ-free (GF) mice. Adv Exp Med Biol. 1995;371A:441–446. - PubMed
    1. Macpherson AJ, Gatto D, Sainsbury E, Harriman GR, Hengartner H, Zinkernagel RM. A primitive T cell-independent mechanism of intestinal mucosal IgA responses to commensal bacteria. Science. 2000;288(5474):2222–2226. doi: 10.1126/science.288.5474.2222. - DOI - PubMed
    1. Neutra M, et al. Identification and use of protective monoclonal IgA antibodies against viral and bacterial pathogens. Adv Exp Med Biol. 1991;310:179–182. - PubMed

Publication types

Substances