. 2011 May;121(5):1956-68.
doi: 10.1172/JCI45169. Epub 2011 Apr 1.

Naturally occurring single amino acid replacements in a regulatory protein alter streptococcal gene expression and virulence in mice

Affiliations

Naturally occurring single amino acid replacements in a regulatory protein alter streptococcal gene expression and virulence in mice

Ronan K Carroll et al. J Clin Invest. 2011 May.

Abstract

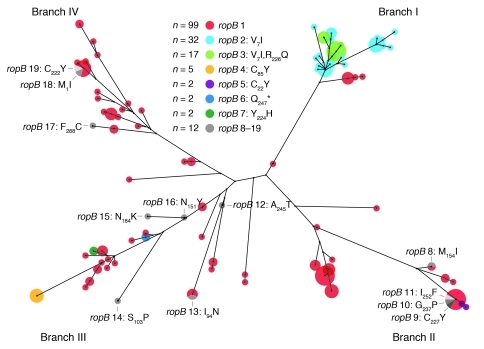
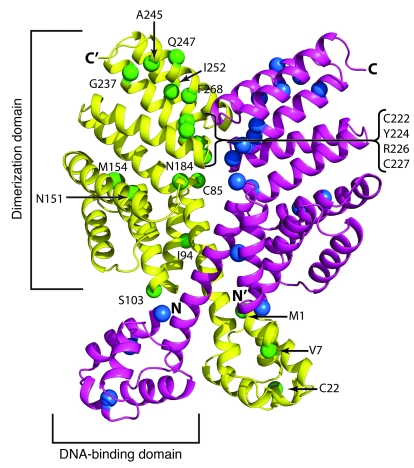
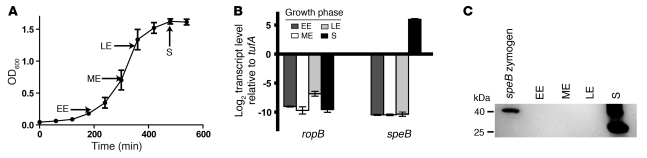
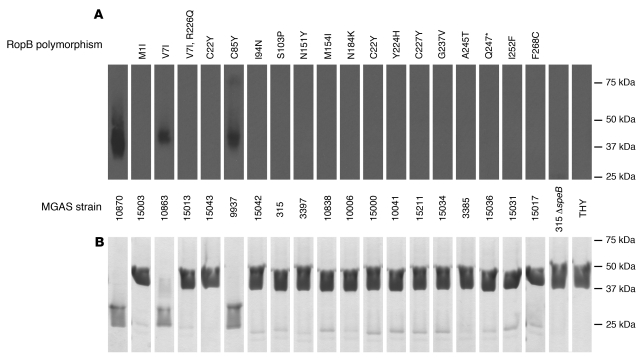
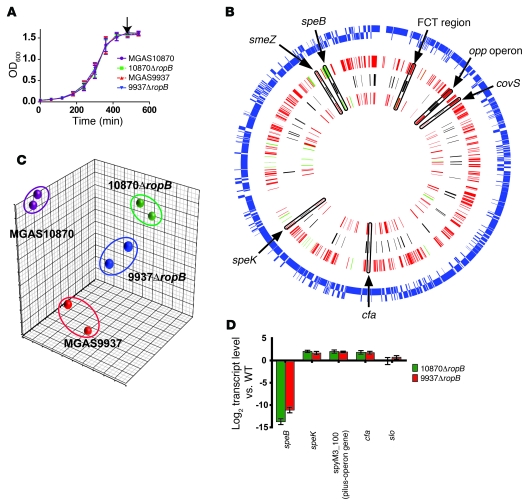
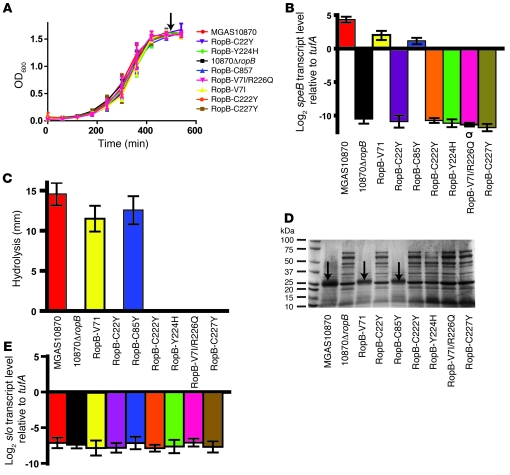
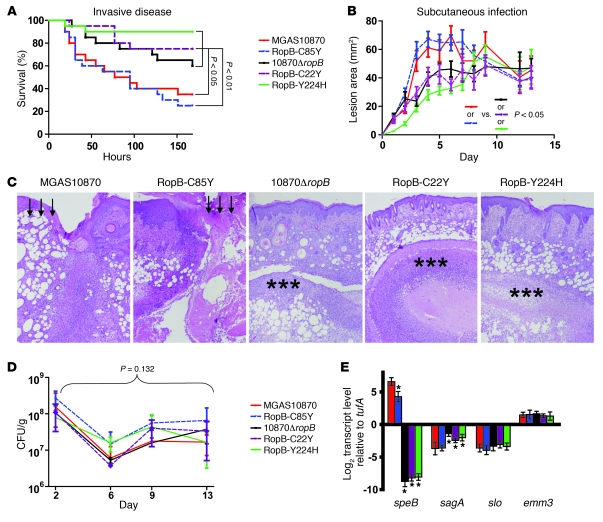
Infection with different strains of the same species of bacteria often results in vastly different clinical outcomes. Despite extensive investigation, the genetic basis of microbial strain-specific virulence remains poorly understood. Recent whole-genome sequencing has revealed that SNPs are the most prevalent form of genetic diversity among different strains of the same species of bacteria. For invasive serotype M3 group A streptococci (GAS) strains, the gene encoding regulator of proteinase B (RopB) has the highest frequency of SNPs. Here, we have determined that ropB polymorphisms alter RopB function and modulate GAS host-pathogen interactions. Sequencing of ropB in 171 invasive serotype M3 GAS strains identified 19 distinct ropB alleles. Inactivation of the ropB gene in strains producing distinct RopB variants had dramatically divergent effects on GAS global gene expression. Additionally, generation of isoallelic GAS strains differing only by a single amino acid in RopB confirmed that variant proteins affected transcript levels of the gene encoding streptococcal proteinase B, a major RopB-regulated virulence factor. Comparison of parental, RopB-inactivated, and RopB isoallelic strains in mouse infection models demonstrated that ropB polymorphisms influence GAS virulence and disease manifestations. These data detail a paradigm in which unbiased, whole-genome sequence analysis of populations of clinical bacterial isolates creates new avenues of productive investigation into the pathogenesis of common human infections.


Figures

Figure 1
Figure 1. Genetic relationships among serotype M3 strains.
An unrooted neighbor-joining tree for 171 strains based on 280 biallelic SNPs located throughout the core chromosome is illustrated (13). Circles superimposed on nodes of the tree are proportionate in area to the number of strains having that haplotype. Circles are color coded by ropB allele. ropB alleles 8 to 19, represented by single strain, are shown in gray and individually labeled. Major branches of the tree are labeled I to IV.
Figure 2
Figure 2. Mapping of the predicted location of amino acid replacements on RopB structural model.
The ribbon representation of the RopB model predicted by I-TASSER is shown. The monomer subunits of the RopB homodimer are shown in yellow and magenta. The areas of the putative DNA-binding and dimerization domains of 1 subunit are labeled. The amino- and carboxytermini of the molecule are denoted as N and C, respectively, and those of the second subunit are indicated by N′ and C′. The positions of the amino acid polymorphisms identified in the invasive serotype M3 strains are shown as colored spheres (blue for 1 subunit and green for the second subunit) and labeled.
Figure 3
Figure 3. Relationship of growth phase to ropB and speB transcript level and SpeB production.
(A) Growth curve of strain MGAS10870 in THY broth. Growth was done in triplicate on 3 separate occasions. Arrows indicate the points at which RNA and culture supernatants were harvested for analysis. EE, early exponential; ME, mid-exponential; LE, late exponential; S, stationary. (B) Transcript level of ropB and speB in strain MGAS10870 measured by TaqMan QRT-PCR and graphed relative to endogenous control gene tufA (71). Biologic replicates were performed in duplicate on 2 separate occasions and analyzed in duplicate. For A and B, the data shown are mean ± SD. (C) Western immunoblot using anti-SpeB polyclonal rabbit antibody and culture supernatants taken at the indicated time points. The zymogen form of SpeB is approximately 40 kDa. The multiple bands observed in the stationary-phase supernatant represent various SpeB maturation isoforms, with the majority of immunoreactive material being mature SpeB (~28 kDa) (72).
Figure 4
Figure 4. Group A streptococcal strains with RopB single-amino-acid replacements produce different amounts of functional SpeB.
(A and B) The quantity and activity of SpeB produced by strains with each of the RopB variants, analyzed by Western immunoblot (A) and SpeB zymogen (SpeBz) cleavage assay (B). MGAS strain numbers and variations in the RopB sequence are indicated for each sample. As shown in B, the SpeB present in culture supernatants of the wild-type RopB, V7I, and C85Y strains readily processed purified recombinant SpeBz C192S from the 40-kDa form to the 28-kDa form, indicating that the detected SpeB was enzymatically active (36). No SpeB or SpeB activity was detected in supernatants from the other strains. Strain MGAS315ΔspeB and sterile THY broth were used as negative controls. In both panels, all samples were run simultaneously on multiple gels and, following image acquisition, lanes were reordered such that RopB polymorphisms were ordered left to right with respect to the amino acid sequence.
Figure 5
Figure 5. Analysis of RopB transcriptome in 2 serotype M3 strains.
(A) Growth curves of parental (MGAS10870, MGAS9937) and isogenic ropB-inactivated (10870ΔropB, 9937ΔropB) strains cultured in THY broth. Growth was done in triplicate on 3 separate occasions with data graphed as mean ± SD. Arrow depicts the point at which samples were taken for expression microarray analysis. (B) Summary of RopB transcriptomes. The outer circle (blue lines) represents the position of each of the 1,865 open reading frames in serotype M3 group A streptococcal strains with genes on the forward strand on the outside and genes on the reverse strand on the inside. The 3 inner circles represent (from the outside in) the RopB regulon in MGAS10870, genes found to be RopB regulated in both strains (in black), and the RopB regulon in MGAS9937 (innermost circle). Each gene is positioned according to its location in the genome. Genes colored red are RopB repressed, whereas genes colored green are activated by RopB. Specific examples of genes found to be RopB regulated in both strains are highlighted. FCT, fibronectin-binding, collagen-binding, T antigen. The FCT region contains the pilus operon genes. (C) Principal components analysis showing inter-sample variation for the expression microarray data set. (D) TaqMan QRT-PCR validation of expression microarray data. For D, samples were grown in duplicate on 2 separate occasions and analyzed in duplicate with data graphed as mean ± SD. For B and D, additional gene descriptions are provided in the text.
Figure 6
Figure 6. Characterization of ropB isoallelic strains.
(A) Growth curves of isoallelic ropB strains cultured in THY broth. Growth was done in triplicate on 3 separate occasions. Arrow indicates the point at which samples were taken for RNA isolation and protein analysis. (B) TaqMan QRT-PCR analysis of speB gene transcript level. Samples were grown in duplicate on 2 separate occasions and analyzed in duplicate. (C) Casein hydrolysis assay determining functional (proteolytically active) SpeB made by indicated strains. Samples were analyzed in triplicate on 3 separate occasions and the data graphed as mean ± SD. (D) SDS-PAGE analysis of culture supernatants from the indicated strains grown in THY. Arrows indicate production of SpeB only by strains MGAS10870, RopB-V7I, and RopB-C85Y, whereas a variety of other protein bands are visible in the SpeB strains. (E) TaqMan QRT-PCR analysis of slo gene transcript level determined as in B. For C and E, strains are indicated in the area between the 2 panels. For AC and E, data are graphed as mean ± SD.
Figure 7
Figure 7. RopB single-amino-acid changes influence group A streptococcal virulence and gene transcript levels during infection.
(A) Twenty outbred CD-1 mice were infected intraperitoneally with 1.0 × 10⁷ CFUs of each indicated strain. Data shown are survival over time, with P values derived from Kaplan-Meier survival analysis. (B) Fifteen immunocompetent hairless mice were infected subcutaneously with 1.0 × 10⁷ CFUs of each indicated strain. Lesion area was recorded daily and data graphed as mean ± SEM. P value refers to comparison of lesion size over time, performed using repeated measures analysis followed by Bonferroni’s adjustment for multiple comparisons. (C) Histologic analysis of lesions (original magnification, ×4) collected on day 9 following infection. Arrows indicate areas of ulceration and necrosis caused by the SpeB+ strains. Asterisks indicate focal abscess formation beneath an intact epithelium in mice infected with the SpeB strains. (D) Bacterial density in skin/soft tissue over time for indicated strains. P value refers to repeated measures analysis of all strains. (E) In vivo gene expression of select group A streptococcal virulence factors was determined as described in Methods. For D and E, colors refer to strain inset, and data are graphed as mean ± SD of 3 biologic replicates. *P < 0.05 compared with parental strain MGAS10870. Gene names are referenced in the text.

Similar articles

Cited by

References

    1. Davies HD, et al. Invasive group A streptococcal infections in Ontario, Canada. Ontario Group A Streptococcal Study Group. N Engl J Med. 1996;335(8):547–554. - PubMed
    1. Fridkin SK, et al. Methicillin-resistant Staphylococcus aureus disease in three communities. . N Engl J Med. 2005;352(14):1436–1444. doi: 10.1056/NEJMoa043252. - DOI - PubMed
    1. Laupland KB, Gregson DB, Church DL, Ross T, Pitout JD. Incidence, risk factors and outcomes of Escherichia coli bloodstream infections in a large Canadian region. . Clin Microbiol Infect. 2008;14(11):1041–1047. - PubMed
    1. Bae IG, et al. Presence of genes encoding the Panton-Valentine leukocidin exotoxin is not the primary determinant of outcome in patients with complicated skin and skin structure infections due to methicillin-resistant Staphylococcus aureus: results of a multinational trial. . J Clin Microbiol. 2009;47(12):3952–3957. doi: 10.1128/JCM.01643-09. - DOI - PMC - PubMed
    1. Afset JE, et al. Identification of virulence genes linked with diarrhea due to atypical enteropathogenic Escherichia coli by DNA microarray analysis and PCR. . J Clin Microbiol. 2006;44(10):3703–3711. doi: 10.1128/JCM.00429-06. - DOI - PMC - PubMed

Publication types