. 2011 May;22(3):400-7.
doi: 10.1097/EDE.0b013e318212fec6.

Family-based gene-by-environment interaction studies: revelations and remedies

Affiliations

Family-based gene-by-environment interaction studies: revelations and remedies

Min Shi et al. Epidemiology. 2011 May.

Abstract

Bias can arise in case-control studies of genotype effects if the underlying population is structured (genetically stratified or admixed). Nuclear-family-based studies enjoy robustness against such bias, provided that inference conditions properly on the parents. Investigators have extended family-based methods to study gene-by-environment interactions, regarding such extensions as retaining robustness. We demonstrate via simulations that, if population structure involves the exposure, nuclear-family-based analyses of gene-by-exposure interaction remain vulnerable to inflated Type I error rates through subtle dependencies that investigators have failed to appreciate. Motivated by the Two Sister Study, an ongoing study of families affected by young-onset breast cancer, we consider a design that supplements the case-parents design with a sibling who is not genotyped but provides exposure data. If, in the population at large, inheritance is Mendelian and genotypes do not influence propensity for exposure, then this 4-person (or tetrad) structure permits the study of genetic effects, exposure effects, and genotype-by-exposure interactions. We show for a dichotomous exposure that, when exposure of an unaffected sibling is available, a modification to the analysis of case-sib or tetrad data re-establishes robustness for tests of multiplicative gene-by-environment interaction. We also use simulations to assess the power for detecting interaction across a range of scenarios, designs, and analytic methods.


Figures

Figure 1
Figure 1
Simulation results on Type I error rate for tests of GxE interaction in a population with strong exposure-related stratification: A. commonly used methods; B. methods using proposed -adjustment. The abscissa indexes single SNP tests for SNPs 1 to 6, followed by a Simes’ test for the 6 SNPs together. Symbols: analysis of case-parents data via the pseudo-sibling approach (open triangle), via FBAT-I (filled square), and via QPL (open square); analysis of case-sib data via conditional logistic regression (filled circle) and via Chatterjee’s method (open circle); analysis of tetrad data (filled triangle); analysis of tetrad data with unaffected sib genotyped via PBAT (×).
Figure 1
Figure 1
Simulation results on Type I error rate for tests of GxE interaction in a population with strong exposure-related stratification: A. commonly used methods; B. methods using proposed -adjustment. The abscissa indexes single SNP tests for SNPs 1 to 6, followed by a Simes’ test for the 6 SNPs together. Symbols: analysis of case-parents data via the pseudo-sibling approach (open triangle), via FBAT-I (filled square), and via QPL (open square); analysis of case-sib data via conditional logistic regression (filled circle) and via Chatterjee’s method (open circle); analysis of tetrad data (filled triangle); analysis of tetrad data with unaffected sib genotyped via PBAT (×).
Figure 2
Figure 2
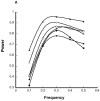
Power of tests of GxE interaction for a homogeneous population under the risk scenario (R1, R2, I1, I2, Re) = (1, 3, 1.5, 2.25, 2): A. for unadjusted models; B. for models with (dashed line) and without (solid line) -adjustment (dashed line with filled triangles represents both the tetrad design and Chatterjee’s method for the case-sib design because after -adjustment their power was the same so the curves coincide). Symbols: analysis of case-parents data via the pseudo-sibling approach (open triangle) and via FBAT-I (filled square); analysis of case-sib data via conditional logistic regression (filled circle) and via Chatterjee’s method (open circle); analysis of tetrad data (filled triangle).
Figure 2
Figure 2
Power of tests of GxE interaction for a homogeneous population under the risk scenario (R1, R2, I1, I2, Re) = (1, 3, 1.5, 2.25, 2): A. for unadjusted models; B. for models with (dashed line) and without (solid line) -adjustment (dashed line with filled triangles represents both the tetrad design and Chatterjee’s method for the case-sib design because after -adjustment their power was the same so the curves coincide). Symbols: analysis of case-parents data via the pseudo-sibling approach (open triangle) and via FBAT-I (filled square); analysis of case-sib data via conditional logistic regression (filled circle) and via Chatterjee’s method (open circle); analysis of tetrad data (filled triangle).
Figure 3
Figure 3
Power of valid tests of GxE interaction (those from -adjusted models) under a scenario with exposure-related stratification. After -adjustment, the power of the tetrad design coincides with that of the Chatterjee’s method; therefore the dashed line with filled triangles represents both methods. Symbols: analysis of case-sib data via conditional logistic regression (filled circle); analysis of tetrad data (filled triangle).

Comment in

References

    1. Self SG, Longton G, Kopecky KJ, Liang KY. On estimating HLA/disease association with application to a study of aplastic anemia. Biometrics. 1991;47(1):53–61. - PubMed
    1. Schaid DJ, Sommer SS. Genotype relative risks: methods for design and analysis of candidate-gene association studies. Am J Hum Genet. 1993;53(5):1114–26. - PMC - PubMed
    1. Cordell HJ, Clayton DG. A unified stepwise regression procedure for evaluating the relative effects of polymorphisms within a gene using case/control or family data: application to HLA in type 1 diabetes. Am J Hum Genet. 2002;70(1):124–41. - PMC - PubMed
    1. Weinberg CR, Wilcox AJ, Lie RT. A log-linear approach to case-parent-triad data: assessing effects of disease genes that act either directly or through maternal effects and that may be subject to parental imprinting. Am J Hum Genet. 1998;62(4):969–78. - PMC - PubMed
    1. Laird NM, Horvath S, Xu X. Implementing a unified approach to family-based tests of association. Genet Epidemiol. 2000;19(Suppl 1):S36–42. - PubMed

Publication types