. 2011 Apr;7(4):e1002030.
doi: 10.1371/journal.pcbi.1002030. Epub 2011 Apr 7.

MDCK cystogenesis driven by cell stabilization within computational analogues

Affiliations

MDCK cystogenesis driven by cell stabilization within computational analogues

Jesse A Engelberg et al. PLoS Comput Biol. 2011 Apr.

Abstract

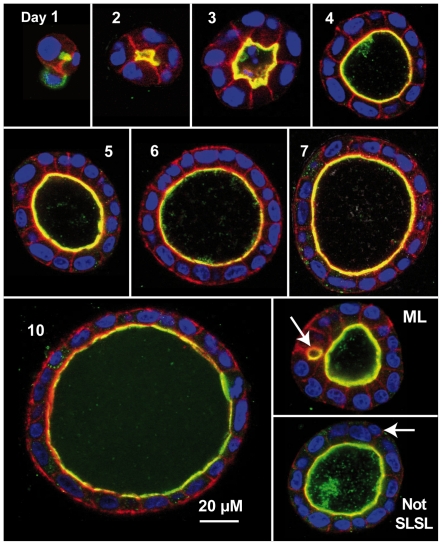
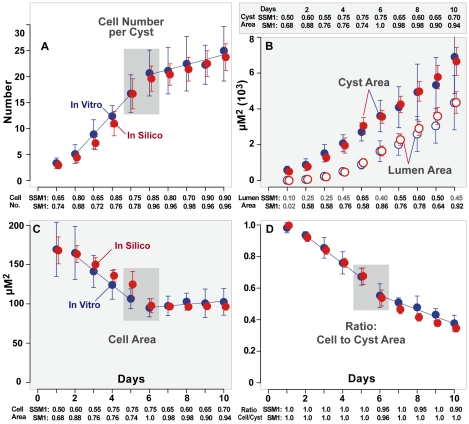
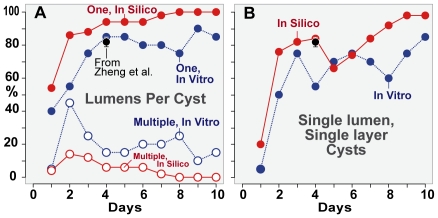
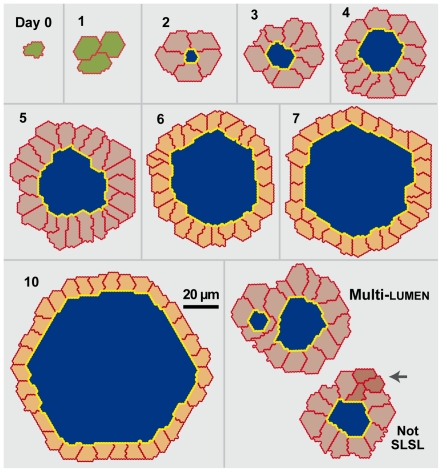
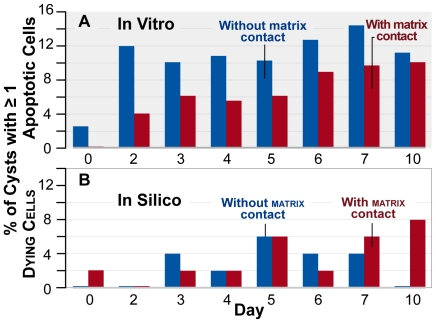
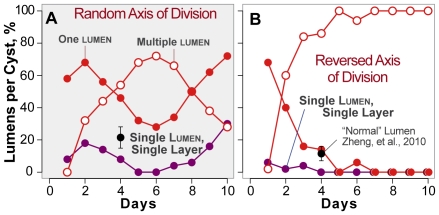
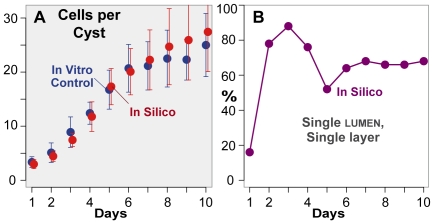
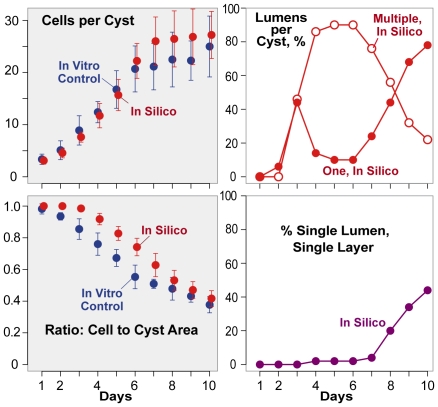
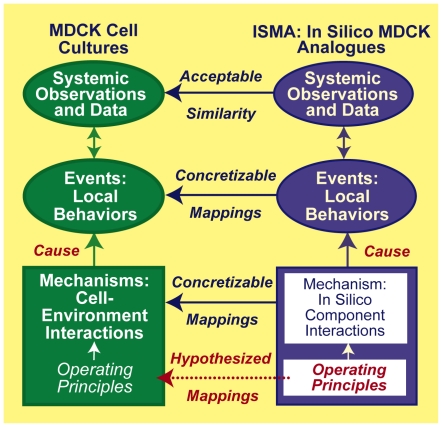
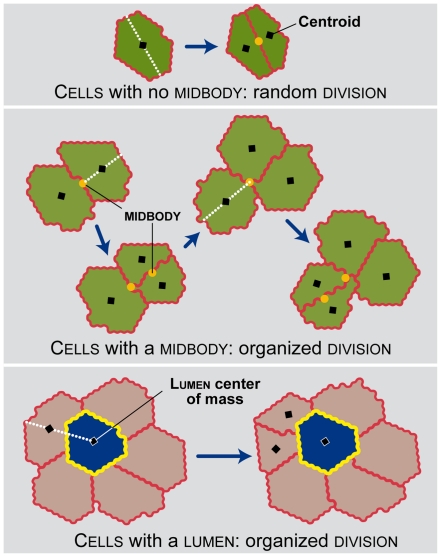
The study of epithelial morphogenesis is fundamental to increasing our understanding of organ function and disease. Great progress has been made through study of culture systems such as Madin-Darby canine kidney (MDCK) cells, but many aspects of even simple morphogenesis remain unclear. For example, are specific cell actions tightly coupled to the characteristics of the cell's environment or are they more often cell state dependent? How does the single lumen, single cell layer cyst consistently emerge from a variety of cell actions? To improve insight, we instantiated in silico analogues that used hypothesized cell behavior mechanisms to mimic MDCK cystogenesis. We tested them through in vitro experimentation and quantitative validation. We observed novel growth patterns, including a cell behavior shift that began around day five of growth. We created agent-oriented analogues that used the cellular Potts model along with an Iterative Refinement protocol. Following several refinements, we achieved a degree of validation for two separate mechanisms. Both survived falsification and achieved prespecified measures of similarity to cell culture properties. In silico components and mechanisms mapped to in vitro counterparts. In silico, the axis of cell division significantly affects lumen number without changing cell number or cyst size. Reducing the amount of in silico luminal cell death had limited effect on cystogenesis. Simulations provide an observable theory for cystogenesis based on hypothesized, cell-level operating principles.


Conflict of interest statement

The authors have declared that no competing interests exist.

Figures

Figure 1
Figure 1. In vitro MDCK cyst cross-sections.
Culture conditions were as described in the text. Confocal images were recorded on the indicated day during cystogenesis. Colors reflect component staining as follows: red: actin; green: gp135/podocalyxn; yellow: red and green colocated; blue: nuclein; black: Matrigel. ML: a multi-lumen cyst. The arrow indicates a second, small lumen. Not SLSL: this single lumen cyst does not have a single layer of cells. The arrow indicates a cell not in contact with lumen.
Figure 2
Figure 2. Quantitative measures of in vitro and in silico cystogenesis.
Mean values and standard deviations for (A) cell number per cyst, (B) cyst and lumen area, (C) mean individual cell area and (D) ratio: cellular to cyst area. Blue: in vitro data taken each day for ten days from 20 cysts. Red: data taken from 50 cysts over ten days using the parameter values in Table 2. Gray boxes: noted changes in behavior. Blue lines: slope of in vitro growth illustrating changes in rate. SSM1: Self -Similarity Measure of in vitro growth; SSM1 indicates the percentage of in vitro values each day that fell within ±25% of the mean in vitro value for that day. SM1: Similarity Measure for ISMA growth. SM1 indicates the percentage of ISMA values each day that fell within ±25% of the mean in vitro value for that day. The target was that SM1>0.5 for nine of ten days. When the target was met, we posited that ISMA measures were experimentally indistinguishable from in vitro measures. Gray SM values did not achieve targeted values.
Figure 3
Figure 3. Percentage of cysts with different numbers of lumens.
(A) Percentage of cysts that have single (solid circle) or multiple (open circle) lumens. (B) Percentage of SLSL (single-layer, single-lumen) cysts. Blue: in vitro data for 20 cysts taken each day for ten days. Red: in silico data for 50 cysts using parameters values from Table 2. Black: mean and standard deviation for “normal” MDCK cysts observed by Zheng et al. as described in the text. Solid lines represent continuous growth of ISMA cysts. Dotted lines represent discrete growth of MDCK cysts.
Figure 4
Figure 4. In silico MDCK analogue cyst cross sections.
Note that a regular hexagon in hexagonal space maps to a circle in continuous space. Images are from a single simulation run using parameter settings from Table 2. Cells are unpolarized (green), polarized (gray) or stabilized (orange). Cell-cell and cell-matrix borders are red; cell-lumen borders are yellow; lumens are blue. Lower right panel: shown is a multi-lumen cyst. Not SLSL: this single lumen cyst does not have a single layer of cells. The arrow indicates two cells not in contact with lumen.
Figure 5
Figure 5. Percentage of cysts with dying cells.
(A) In vitro data reproduced from . (B) ISMA data from 50 cysts over ten days. Blue bars: percentage of cysts observed to have apoptotic cells without matrix contact. Red bars: percentage of cysts observed to have apoptotic cells with matrix contact.
Figure 6
Figure 6. Percentage of ISMA cysts with varied lumen number when the axis of cell division is abnormal.
Shown are the percentages of cysts that have single (solid red circles) or multiple (open red circles) lumens when the axis division is (A) random or (B) reversed (rotated 90°) along with the percentage of cysts that are SLSL (purple circles) when the axis of cell division is (A) random or (B) reversed. Black (A and B): mean and standard deviation for “normal” MDCK cysts observed by Zheng et al. . The in vitro control data are shown in Figure 3.
Figure 7
Figure 7. Cystogenesis measures with no luminal cell death.
ISMA simulations executed with the parameter values from Table 2 except that luminal cell death was not allowed. (A) Red: mean values and standard deviations for cell number per cyst. Blue: in vitro control data from Figure 2A. (B) Percentage of SLSL cysts.
Figure 8
Figure 8. Cystogenesis measures when cell polarization was delayed.
ISMA simulations executed with the parameters values from Table 2 except that cell polarization was delayed as described in the text. Left: mean values and standard deviations for cell number per cyst (top panel) and ratio of cellular to cyst area (bottom panel). Right: Percentage of cysts with single, multiple, and SLSL lumens. Designations and symbols are the same as in Figures 2 and 3.
Figure 9
Figure 9. ISMA-to-in vitro cell culture mappings.
Left: MDCK cell cultures are the referent wet-lab systems. During experiments, cells draw on genetically controlled operating principles, and cystogenesis is the result. Influential mechanistic details are reflected in the collected data. Right: an abstract mechanistic description, a set of targeted attributes, and specifications paired to those attributes direct analogue design. Software components are designed, specified, coded, verified, and assembled guided by that mechanistic description. The product of the process is a collection of abstract mechanisms rendered in software. A clear mapping is intended between ISMA cells, their axioms and operating principles, and MDCK cell and intracellular details. Relative similarity is controlled in part by parameterizations. Importantly, that mapping can be concretized iteratively. Compilation and source code execution gives rise to a working ISMA. Its dynamics are intended to represent abstractly corresponding dynamics (both observed in movies and believed to occur) within cultures during ten-day experiments. That mapping can also be concretized iteratively. Measures of cystogenesis provide time series data that are intended to be quantitatively similar (according to prespecified criteria) to corresponding measures of MDCK cell cystogenesis. Achieving increasingly stringent SMs provides degrees of validation.
Figure 10
Figure 10. Key features of ISMA logic and decision control flow.
During a simulation cycle, each cell steps through five logic modules sequentially to decide which actions to take based on its local environment and internal state. A lumen's target area is adjusted; lumens can merge with each other. Cells that are not dying may begin to do so. Cells adjust their area based on their state and the state of neighboring cells; they stabilize if the lumen has reached a critical size. Cells can create new lumens. Under specified conditions they can divide to form new cells. Future versions of ISMA logic may randomize action control in order to simulate the parallel nature of event occurrence both within MDCK cultures and within each cell. See Figure S12 for complete details of the logic within each of the five modules.
Figure 11
Figure 11. MCell point assignment flow chart.
An MCell point has no specific cystogenesis counterpart. Once per simulation cycle, each point is assigned to the MCell agent associated with the cell enclosing that point. MCell point lists are initialized during each simulation cycle. Additionally, surrounding cells engulf isolated points.
Figure 12
Figure 12. ISMA cell division. Cell division depends on the cell neighborhood.
Single isolated cells (top) that have not divided have no midbody and divide with a random axis of division. When cells divide they find their centroid and store it as the midbody of their daughter cells. Cells that have previously divided and have a midbody utilize it for subsequent divisions. For these organized divisions (top), the axis of division is determined by a line drawn from a cell's current centroid to the stored midbody. Cells in contact with a lumen will also divide in an organized fashion (bottom), using a line between their centroid and that of the lumen to determine the axis of division. When the axis of division is determined, all points on one side of the line are assigned to a new cell while all points on the other remain assigned to the original cell.

Similar articles

Cited by

References

    1. Kim SH, Debnath J, Mostov K, Park S, Hunt CA. A computational approach to resolve cell level contributions to early glandular epithelial cancer progression. BMC Syst Biol. 2009;3:122. - PMC - PubMed
    1. Kim SH, Park S, Mostov K, Debnath J, Hunt CA. Computational investigation of epithelial cell dynamic phenotype in vitro. Theor Biol Med Model. 2009;6:8. - PMC - PubMed
    1. Grant MR, Mostov KE, Tlsty TD, Hunt CA. Simulating properties of in vitro epithelial cell morphogenesis. PLoS Comput Biol. 2006;2:e129. - PMC - PubMed
    1. Gin E, Tanaka EM, Brusch L. A model for cyst lumen expansion and size regulation via fluid secretion. J Theor Biol. 2010;264:1077–1088. - PubMed
    1. Wang AZ, Ojakian GK, Nelson WJ. Steps in the morphogenesis of a polarized epithelium. I. uncoupling the roles of cell-cell and cell-substratum contact in establishing plasma membrane polarity in multicellular epithelial (MDCK) cysts. J Cell Sci. 1990;95:137–151. - PubMed

Publication types