. 2011:2011:875028.
doi: 10.1155/2011/875028. Epub 2011 Jan 18.

CD8 T-Cell Responses before and after Structured Treatment Interruption in Ugandan Adults Who Initiated ART with CD4 T Cells <200 Cell/μL: The DART Trial STI Substudy

Affiliations

CD8 T-Cell Responses before and after Structured Treatment Interruption in Ugandan Adults Who Initiated ART with CD4 T Cells <200 Cell/μL: The DART Trial STI Substudy

Jennifer Serwanga et al. AIDS Res Treat. 2011.

Abstract

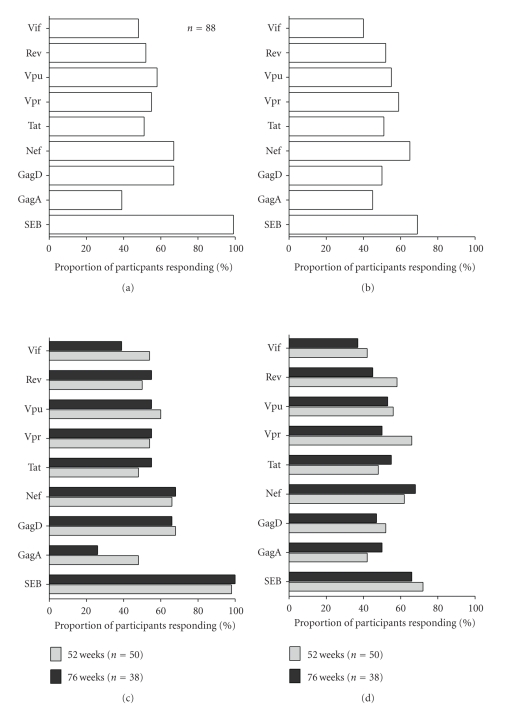
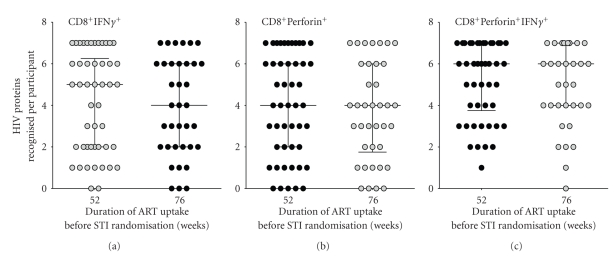
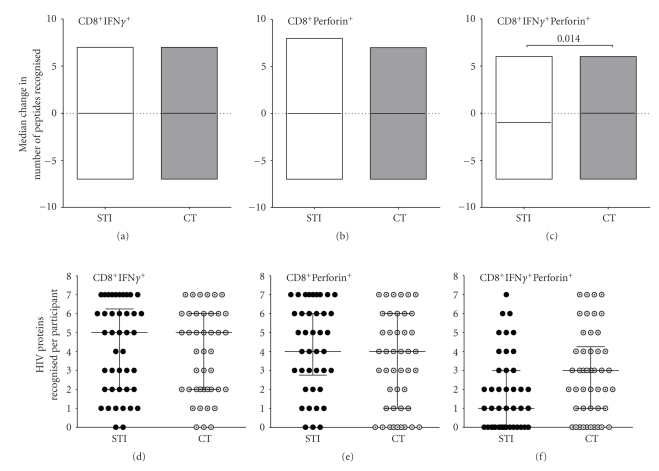
Objective. To better understand attributes of ART-associated HIV-induced T-cell responses that might be therapeutically harnessed. Methods. CD8(+) T-cell responses were evaluated in some HIV-1 chronically infected participants of the fixed duration STI substudy of the DART trial. Magnitudes, breadths, and functionality of IFN-γ and Perforin responses were compared in STI (n = 42) and continuous treatment (CT) (n = 46) before and after a single STI cycle when the DART STI trial was stopped early due to inferior clinical outcome in STI participants. Results. STI and CT had comparable magnitudes and breadths of monofunctional CD8(+)IFNγ(+) and CD8(+)Perforin(+) responses. However, STI was associated with significant decline in breadth of bi-functional (CD8(+)IFNγ(+)Perforin(+)) responses; P = .02, Mann-Whitney test. Conclusions. STI in individuals initiated onto ART at <200 CD4(+) T-cell counts/μl significantly reduced occurrence of bifunctional CD8(+)IFNγ(+)/Perforin(+) responses. These data add to others that found no evidence to support STI as a strategy to improve HIV-specific immunity during ART.


Figures

Figure 1
Figure 1
HIV-specific CD8+ T-cell responses at STI/CT randomization. This figure compares the proportions (%) of participants (n = 88) inducing (a) HIV-specific IFN-γ or (b) Perforin responses at the time point of STI/CT randomization and proportions of participants inducing (c) HIV-specific IFN-γ or (d) Perforin responses at STI/CT randomization initiated 52 or 76 weeks after ART.
Figure 2
Figure 2
Relationship between breadth of HIV-specific CD8+ T-cell recognition at STI/CT randomization and the duration of pre-ART randomization. This figure evaluates whether ART uptake for either 52 weeks or 76 weeks preceding randomization had any influence on the breadths of HIV-specific (a) CD8+IFNγ +, (b) CD8+Perforin+, or (c) CD8+IFNγ +Perforin+ T-cell responses. Individual HIV peptides were grouped together in pools according to HIV protein. HIV-specific T-cell recognition was evaluated against these pools that were based on consensus sequences of HIV-1 Gag clades A (92UG037) and D (94UG114); and consensus sequences of HIV-1 clade B (Nef, Tat, Vif, Rev, Vpr, Vpu, and Pol). HIV-specific responses to Gag (clades A and D) were considered concomitantly. Breadth was defined as the number of HIV protein pools recognised per individual. Horizontal bars represent medians and interquartile ranges.
Figure 3
Figure 3
Magnitudes of CD8+ T-cell responses associated with STI. This figure compares the median magnitudes of HIV-induced CD8+ T-cell IFN-γ responses in (a) STI and CT participants after one cycle of STI or matching time on CT. Bars represent medians, while error bars represent interquartile ranges. The shaded areas represent HIV proteins that induced significantly lower magnitudes of CD8+IFN-γ + than Gag or Nef. (c) illustrates the median change in magnitudes of HIV-specific IFN-γ responses after one cycle of STI or matching time on CT. Horizontal bars represent medians.
Figure 4
Figure 4
Breadths of CD8+ T-cell responses after 12 weeks of STI and matching time point on CT. Study participants were evaluated for CD8+ T-cell responses to complete peptide pools corresponding to Gag, Nef, Tat, Vpr, Vpu, Rev and Vif HIV proteins. Response to the two Gag pools was analysed concomitantly to represent response to the Gag protein. Breadth of CD8+ T-cell response was defined as the number of HIV pools recognised by an individual. Median change in breadth was defined as the increase or decrease in number of pools recognised. Positive readouts indicate increase while negative readouts indicate decrease. The figure demonstrates changes in the breadth of CD8+IFNγ + (a), CD8+Perforin+ (b) and CD8+IFNγ +Perforin+, (c) responses among CT and STI participants; and compares the median number of peptide pools targeted with the induction of CD8+IFNγ + (d), CD8+Perforin+ (e), and CD8+IFNγ +Perforin+ (f) at the end of one STI cycle. Horizontal lines represent medians.

Similar articles

Cited by

References

    1. Casazza JP, Betts MR, Picker LJ, Koup RA. Decay kinetics of human immunodeficiency virus-specific CD8+ T cells in peripheral blood after initiation of highly active antiretroviral therapy. Journal of Virology. 2001;75(14):6508–6516. - PMC - PubMed
    1. Mollet L, Li T-S, Samri A, et al. Dynamics of HIV-specific CD8+ T lymphocytes with changes in viral load. Journal of Immunology. 2000;165(3):1692–1704. - PubMed
    1. Gray CM, Lawrence J, Schapiro JM, et al. Frequency of class I HLA-restricted anti-HIV CD8+ T cells in individuals receiving highly active antiretroviral therapy (HAART) Journal of Immunology. 1999;162(3):1780–1788. - PubMed
    1. Alatrakchi N, Duvivier C, Costagliola D, et al. Persistent low viral load on antiretroviral therapy is associated with T cell-mediated control of HIV replication. AIDS. 2005;19(1):25–33. - PubMed
    1. Nicastri E, Leone S, Angeletti C, et al. Sex issues in HIV-1-infected persons during highly active antiretroviral therapy: a systematic review. Journal of Antimicrobial Chemotherapy. 2007;60(4):724–732. - PubMed