

Functional alteration of a dimeric insecticidal lectin to a monomeric antifungal protein correlated to its oligomeric status
- PMID: 21490929
- PMCID: PMC3072408
- DOI: 10.1371/journal.pone.0018593
Functional alteration of a dimeric insecticidal lectin to a monomeric antifungal protein correlated to its oligomeric status
Abstract
Background: Allium sativum leaf agglutinin (ASAL) is a 25-kDa homodimeric, insecticidal, mannose binding lectin whose subunits are assembled by the C-terminal exchange process. An attempt was made to convert dimeric ASAL into a monomeric form to correlate the relevance of quaternary association of subunits and their functional specificity. Using SWISS-MODEL program a stable monomer was designed by altering five amino acid residues near the C-terminus of ASAL.
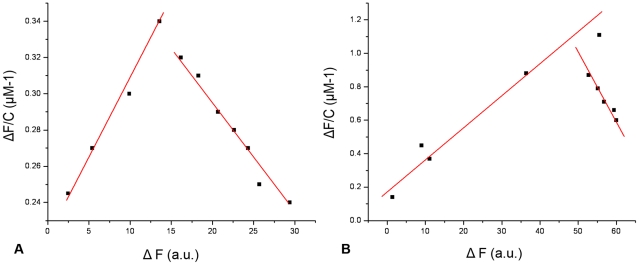
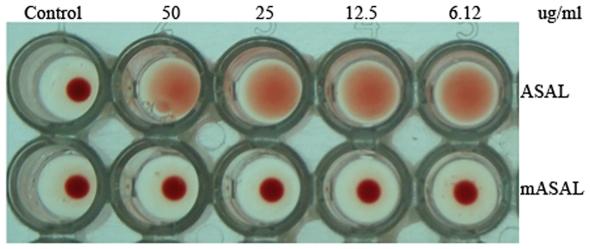
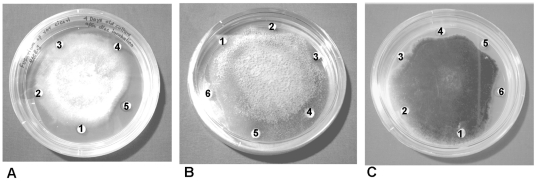
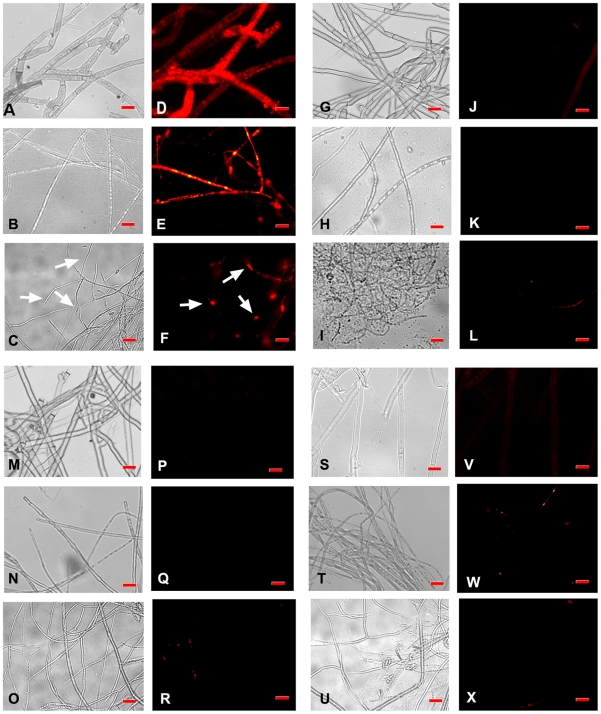
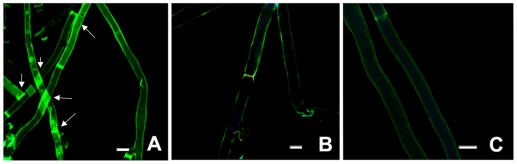
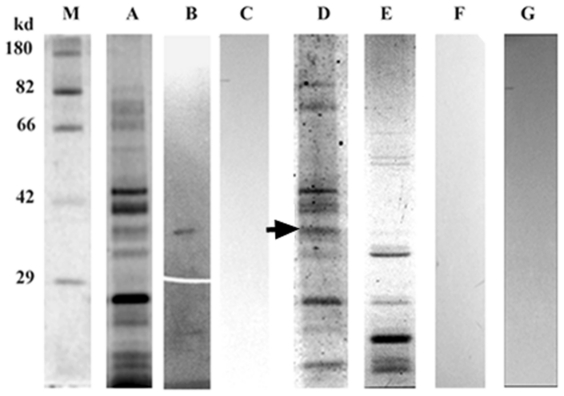
Methodology/principal findings: By introduction of 5 site-specific mutations (-DNSNN-), a β turn was incorporated between the 11(th) and 12(th) β strands of subunits of ASAL, resulting in a stable monomeric mutant ASAL (mASAL). mASAL was cloned and subsequently purified from a pMAL-c2X system. CD spectroscopic analysis confirmed the conservation of secondary structure in mASAL. Mannose binding assay confirmed that molecular mannose binds efficiently to both mASAL and ASAL. In contrast to ASAL, the hemagglutination activity of purified mASAL against rabbit erythrocytes was lost. An artificial diet bioassay of Lipaphis erysimi with mASAL displayed an insignificant level of insecticidal activity compared to ASAL. Fascinatingly, mASAL exhibited strong antifungal activity against the pathogenic fungi Fusarium oxysporum, Rhizoctonia solani and Alternaria brassicicola in a disc diffusion assay. A propidium iodide uptake assay suggested that the inhibitory activity of mASAL might be associated with the alteration of the membrane permeability of the fungus. Furthermore, a ligand blot assay of the membrane subproteome of R. solani with mASAL detected a glycoprotein receptor having interaction with mASAL.
Conclusions/significance: Conversion of ASAL into a stable monomer resulted in antifungal activity. From an evolutionary aspect, these data implied that variable quaternary organization of lectins might be the outcome of defense-related adaptations to diverse situations in plants. Incorporation of mASAL into agronomically-important crops could be an alternative method to protect them from dramatic yield losses from pathogenic fungi in an effective manner.
Conflict of interest statement
Figures
Similar articles
-
Deciphering the mode of action of a mutant Allium sativum Leaf Agglutinin (mASAL), a potent antifungal protein on Rhizoctonia solani.BMC Microbiol. 2015 Oct 26;15:237. doi: 10.1186/s12866-015-0549-7. BMC Microbiol. 2015. PMID: 26502719 Free PMC article.
-
Monitoring the efficacy of mutated Allium sativum leaf lectin in transgenic rice against Rhizoctonia solani.BMC Biotechnol. 2016 Mar 1;16:24. doi: 10.1186/s12896-016-0246-0. BMC Biotechnol. 2016. PMID: 26932667 Free PMC article.
-
Purification and characterization of a lectin with high hemagglutination property isolated from Allium altaicum.Protein J. 2011 Aug;30(6):374-83. doi: 10.1007/s10930-011-9342-0. Protein J. 2011. PMID: 21732172
-
Receptors of garlic (Allium sativum) lectins and their role in insecticidal action.Protein J. 2012 Aug;31(6):439-46. doi: 10.1007/s10930-012-9423-8. Protein J. 2012. PMID: 22623282 Review.
-
Omics-driven bioinformatics for plant lectins discovery and functional annotation - A comprehensive review.Int J Biol Macromol. 2024 Nov;279(Pt 4):135511. doi: 10.1016/j.ijbiomac.2024.135511. Epub 2024 Sep 10. Int J Biol Macromol. 2024. PMID: 39260647 Review.
Cited by
-
Functional characterization of Rorippa indica defensin and its efficacy against Lipaphis erysimi.Springerplus. 2016 Apr 23;5:511. doi: 10.1186/s40064-016-2144-2. eCollection 2016. Springerplus. 2016. PMID: 27186475 Free PMC article.
-
Deciphering the mode of action of a mutant Allium sativum Leaf Agglutinin (mASAL), a potent antifungal protein on Rhizoctonia solani.BMC Microbiol. 2015 Oct 26;15:237. doi: 10.1186/s12866-015-0549-7. BMC Microbiol. 2015. PMID: 26502719 Free PMC article.
-
Molecular and Nano-Structural Optimization of Nanoparticulate Mn2+-Hexarhenium Cluster Complexes for Optimal Balance of High T1- and T2-Weighted Contrast Ability with Low Hemoagglutination and Cytotoxicity.Pharmaceutics. 2022 Jul 20;14(7):1508. doi: 10.3390/pharmaceutics14071508. Pharmaceutics. 2022. PMID: 35890403 Free PMC article.
-
Cationic Star Polymers Obtained by the Arm-First Approach─Influence of Arm Number and Positioning of Cationic Units on Antimicrobial Activity.Biomacromolecules. 2025 Jan 13;26(1):190-200. doi: 10.1021/acs.biomac.4c00882. Epub 2024 Dec 2. Biomacromolecules. 2025. PMID: 39620381 Free PMC article.
-
Complexation of Oligo- and Polynucleotides with Methoxyphenyl-Functionalized Imidazolium Surfactants.Pharmaceutics. 2022 Dec 1;14(12):2685. doi: 10.3390/pharmaceutics14122685. Pharmaceutics. 2022. PMID: 36559178 Free PMC article.
References
-
- Van Damme EJM, Peumans W J, Barre A, Rouge P. Plant Lectins: A Composite of Several Distinct Families of Structurally and Evolutionary Related Proteins with Diverse Biological Roles. Crit Rev Plant Sci. 1998;17:575–692.
-
- Vijayan M, Chandra N. Lectins. Curr Opin Struct Biol. 1999;9:707–714. - PubMed
-
- Chandra NR, Prabu MM, Suguna K, Vijayan M. Structural similarity and functional diversity in proteins containing the legume lectin fold. Protein Eng. 2001;14:857–866. - PubMed
-
- Chandra NR, Ramachandraiah G, Bachhawat K, Dam T K, Surolia A, et al. Crystal structure of a dimeric mannose specific agglutination from garlic. J Mol Biol. 1999;285(3):1157–1168. - PubMed
Publication types
MeSH terms
Substances
LinkOut - more resources
Full Text Sources
