. 2011 Apr 7;6(4):e18605.
doi: 10.1371/journal.pone.0018605.

The stimulatory Gα(s) protein is involved in olfactory signal transduction in Drosophila

Affiliations

The stimulatory Gα(s) protein is involved in olfactory signal transduction in Drosophila

Ying Deng et al. PLoS One. .

Abstract

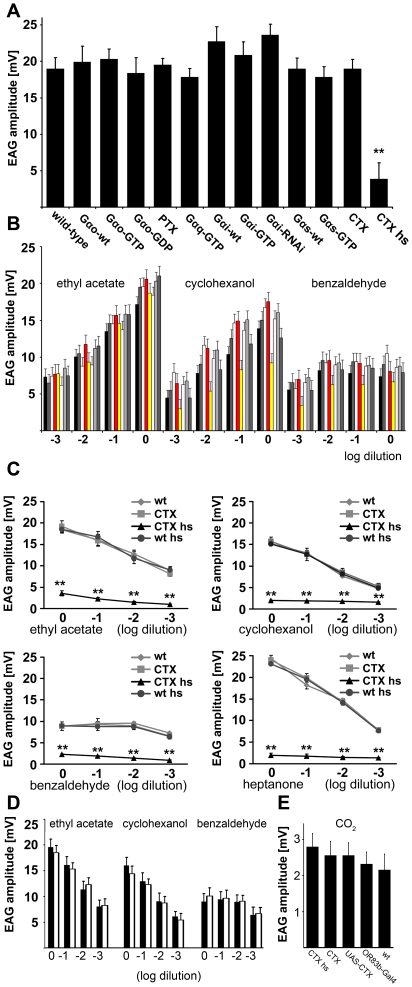
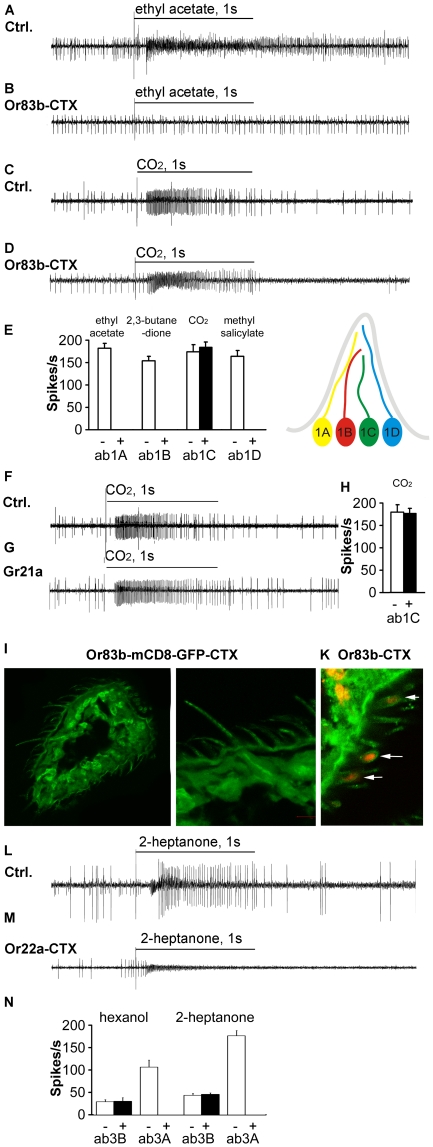
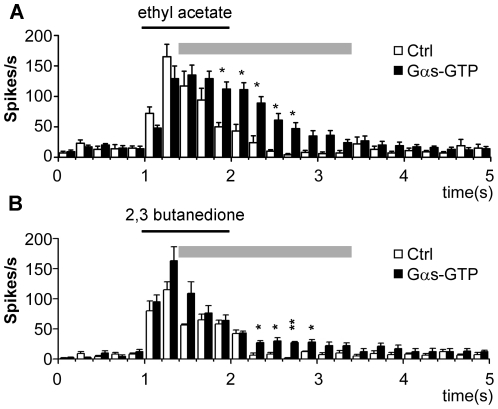
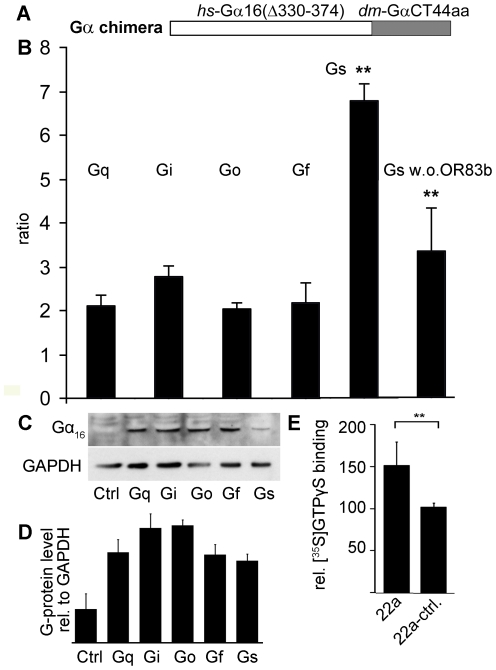
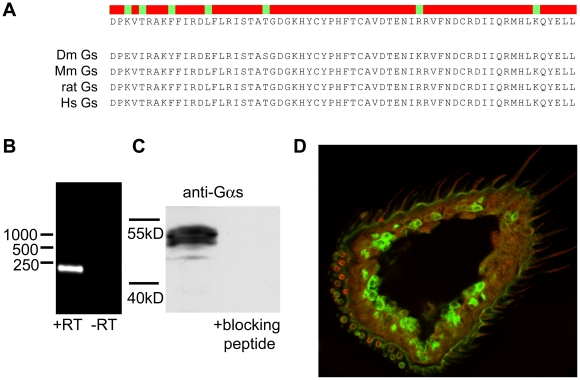
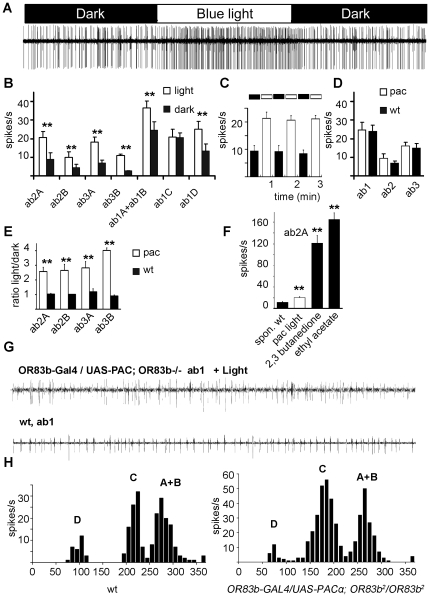
Seven-transmembrane receptors typically mediate olfactory signal transduction by coupling to G-proteins. Although insect odorant receptors have seven transmembrane domains like G-protein coupled receptors, they have an inverted membrane topology, constituting a key difference between the olfactory systems of insects and other animals. While heteromeric insect ORs form ligand-activated non-selective cation channels in recombinant expression systems, the evidence for an involvement of cyclic nucleotides and G-proteins in odor reception is inconsistent. We addressed this question in vivo by analyzing the role of G-proteins in olfactory signaling using electrophysiological recordings. We found that Gα(s) plays a crucial role for odorant induced signal transduction in OR83b expressing olfactory sensory neurons, but not in neurons expressing CO₂ responsive proteins GR21a/GR63a. Moreover, signaling of Drosophila ORs involved Gα(s) also in a heterologous expression system. In agreement with these observations was the finding that elevated levels of cAMP result in increased firing rates, demonstrating the existence of a cAMP dependent excitatory signaling pathway in the sensory neurons. Together, we provide evidence that Gα(s) plays a role in the OR mediated signaling cascade in Drosophila.


Conflict of interest statement

Competing Interests: The authors have declared that no competing interests exist.

Figures

Figure 1
Figure 1. Screening G-proteins for participation in olfactory signal transduction.
(A) UAS constructs of different Gα-proteins, mutated Gα-proteins and G-protein affecting toxins were expressed in the sensory neurons of the third antennal segment using an Or83b-Gal4 driver line, last bars present heat shocked Or83b-Gal4;UAS-CTX flies (CTX hs) and Or83b-Gal4;UAS-CTX flies without heat shock (CTX). EAG amplitudes in response to application of undiluted ethyl acetate were recorded (n>10 flies were recorded). The difference between wt and heat shocked CTX flies was statistically checked by the unpaired Student's t test, **P≤0.01. (B) EAG amplitudes of different G-protein mutant flies (n>10 flies were recorded), expression of UAS constructs were driven by Or83b-Gal4. Odorant used were ethyl actetate, cyclohexanol and benzaldehyde, each in concentrations of 10−3, 10−2, 10−1, and undiluted. The fly strains tested were wt, PTX, Gαs wt, Gαs-GTP (marked in red), Gαq-GTP (marked in yellow), Gαo-GTP, Gαo-GDP, Gαo-wt (from left to right for each odorant dilution). If several doses were tested on the same antenna, lower doses were presented first, inter-stimulus intervals were at least 30 s. Significant differences were only observed for the responses of Gαq-GTP expressing flies towards cyclohexanol and low concentrations of benzaldehyde (shown in more detail in Figure S2A). Flies were statistically checked (pairwise) by unpaired Student's t tests; significance levels were set according to the Bonferroni post hoc test for k = 4 means,*P≤0.0125; **P≤0.0025. (C) EAG amplitudes (in mV) upon exposure to different concentrations of 4 odorants in wt flies, Or83b-Gal4;UAS-CTX flies (CTX), heat shocked Or83b-Gal4;UAS-CTX flies (CTX hs), and heat shocked wt flies (wt hs). The differences between CTX hs flies and wt, wt hs, CTX flies were statistically checked (pairwise) by unpaired Student's t tests; significance levels were set according to the Bonferroni post hoc test for k = 4 means, **P≤0.0025. (D) EAG amplitudes of heat shocked UAS-CTX flies without Or83b-Gal4 driver (white bars) compared to non heat-shocked flies (black bars). (E) EAG amplitudes of heat shocked Or83b-Gal4;UAS-CTX flies (CTX hs, p = 0.04), Or83b-Gal4;UAS-CTX (CTX, p = 0.02), UAS-CTX (p = 0.26), Or83b-Gal4 (p = 0.29), and wt flies to application of CO2 (according to significance levels for k = 5 means, * would have been assigned for P≤0.01). Error bars represent s.e.m.
Figure 2
Figure 2. Gαs mediates odorant signaling in fly olfactory neurons.
Single unit recordings from the ab1 sensillum stimulated with ethyl acetate (diluted 1∶100) (A, B) and CO2 (C, D), known to activate two of the four neurons selectively. CO2 activates the ab1C neuron not expressing OR83b, ethyl acetate activates the ab1A neurons expressing OR83b. Ligand application in control flies (ctrl: Or83b-Gal4;UAS-CTX flies, no heat-shock) results in an increase in spike rates with both stimuli (A, C), whereas CTX expressing flies (Or83b-Gal4;UAS-CTX flies, heat-shocked) do respond only to CO2 (B, D). (E) Summary of single sensillum data for all four neuron types in the ab1 sensillum, odorants were diluted 1∶100, CO2 concentration was ∼14% (n>10 flies) and schematic representation of the ab1 sensillum bearing four neurons. White bars represent recordings from control flies (also labeled by - beneath the axis), black bars are responses from flies expressing CTX in Or83b neurons (also labeled with +). (F) CO2 response of the ab1C neuron of a control fly (Or21a-Gal4;UAS-CTX without heat shock) and (G) CO2 responses of the ab1C neuron expressing CTX (Or83b-Gal4;UAS-CTX flies, heat-shocked) remained normal after heat shock. (H) Summary of single sensillum data for ab1C neuron, CO2 was applied at ∼14% (n>10 flies). White bars represent recordings from control flies (also labeled by - beneath the axis), black bars are responses from flies expressing CTX in Gr21a positive neurons (also labeled with +). (I) Cellular morphology was normal heat shocked flies expressing CTX and mCD8-GFP under the control of the Or83b promoter. (K) Immunohistochemistry showed that OR83b (red, labeled with arrows) is correctly localized to the dendrite of flies expressing CTX under the control of the Or83b promoter. (L) Application of 2-heptanone to the ab3 sensillum activates both neurons (ab3A and ab3B) in control flies (OR22a-Gal4;UAS-CTX without heat shock). (M) Expression of CTX under the control of the OR22a promoter (OR22a-Gal4;UAS-CTX flies, heat-shocked) abolished the 2-heptanone response of the ab3A neuron. (N) Summary of single sensillum data for both neuron types in the ab3 sensillum, odorants (hexanol and 2-heptanone) were diluted 1∶100 (n>10 flies), white bars represent recordings from control flies (OR22a-Gal4; UAS-CTX without heat shock) (also labeled by - beneath the axis), black bars are responses from flies expressing CTX in Or22a positive neurons flies (heat shocked OR22a-Gal4; UAS-CTX) (also labeled with +). Error bars represent s.e.m.
Figure 3
Figure 3. Expression of constitutively active Gαs.
(A) Summary of the responses in single unit recordings of ab1A neurons in Or83b-Gal4; UAS-Gαs-GTP flies, expressing a GTPase deficient Gαs mutant. Flies showed no difference in the initial increase in spike rates upon application of ethyl acetate (1∶100), but show a slower decay of the spike rates back to normal levels due to slowed GTP hydrolysis. The ligand was applied for 1s. (B) Similar results were obtained using 2,3-butanedione (1∶100) as ligand. Differences between the indicated data points (decay of the signal, grey bars) were statistically checked by the unpaired Student's t test, significance levels were set according to the Bonferroni post hoc test for k = 10 means (data points during signal decay, indicated by a grey line on top of the bar chart), **P≤0.005, *P≤0.001. Error bars represent s.e.m.
Figure 4
Figure 4. Role of G-proteins in signaling of recombinantly expressed olfactory receptors.
(A) Chimeric construct with N-terminus of human Gα16 and the C-terminus of Drosophila Gα-proteins. (B) Ratio of transfected HEK293 cells responding to 500 µM cyclohexanone in Ca2+ imaging experiments; cells either express OR43a, OR83b and the respective G-protein chimera, OR43a alone and the respective G-protein chimera, or OR43a, OR83b and full length human Gα16. An increase in the ratio means that more cells responded upon co-expression of the G-protein chimera (n>5 independent transfections). The ratio determined with the Gαs chimera was compared to the ratios obtained with the other G-protein chimera and was found to be signify-cantly different from all of them. (C) Western blot detection of recombinantly expressed G-protein chimera with an antibody against Gα16, equal amounts of protein was loaded per lane (controlled by GAPDH detection), control (ctrl) were non-transfected HEK293 cells. (D) Quantification of western blot analysis by densiometry, G-protein and GAPDH bands were ana-lyzed from cell preparations from 3 independent transfections. Band intensities originating from Gα16 stained membranes were divided by band intensities from GAPDH stained membranes. The small differences between the intensities from the different chimera were not significant (tested with Student's t-test). (E) [35S]GTPγS binding to membrane preparations upon odorant stimu-lation, cells were transfected with ORs and Gα-protein, control cells were mock transfected. The reaction was carried out in triplicates. Differences between the indicated data points were statistically checked by the unpaired Student's t test, **p<0.01. Error bars represent s.e.m.
Figure 5
Figure 5. Drosophilas is localized in the sensilla of the olfactory sensory neurons.
(A) Alignment of C-termini of Gαs from different species showing the high degree of conservation in this part of the protein. (B) RT-PCR with RNA prepared from manually collected antennae using Gαs specific primers (+ RT), control lane is RNA without reverse transcription (-RT). (C) Western blot of manually collected antennae probed with anti-Gαs showing a band approximately 50 kD, which disappears after pre-incubation of the antibody with a specific blocking peptide. (D) Staining of the third antennal segment using Gαs specific antibodies. Red - Gαs; Green – mCD8-GFP (Or83b-Gal4; UAS-mCD8-GFP).
Figure 6
Figure 6. Increased cAMP levels can recover the spontaneous activity of olfactory neurons.
(A) Increase in spike rates in single unit recordings from the ab2 sensillum in Or83b-Gal4; UAS-Pacα flies upon transition from dark to strong blue light excitation showing that cAMP increase stimulates an excitatory pathway in olfactory neurons, the increase was rapidly reversible. (B) Summaries of single unit recordings from the different neurons in the ab1, ab2 and ab3 sensilla. (C) Reversibility of the response to light shown by repeated 30 s on/off cycles in ab2A neurons. (D) Summaries of single unit recordings from ab1, ab2 and ab3 sensilla from wt (white bars) and Or83b-Gal4; UAS-Pacα flies (black bars) recorded in the dark. (E) Ratios of spike rates for ab2A, ab2B, ab3A and ab3B neurons recorded under blue light illumination vs. dark, showing the relative increases in spike rates in wt (black bars) and Or83b-Gal4; UAS-Pacα flies (white bars). (F) Comparison of the light induced spike rate in the ab2A neuron in Or83b-Gal4; UAS-Pacα flies (white bar) to spontaneous and odor induced spike rates in wt (black bars) flies. (G) Single unit recording of wt ab1 sensillum and of the blue light illuminated Or83b-Gal4/UAS-PACα; Or83b2/Or83b2 ab1 sensillum. (H) Analysis of the of spike amplitude distribution recorded from ab1 sensilla in wt and Or83b-Gal4/UAS-PACα; Or83b2/Or83b2 flies. Data shown represent about 450 spikes form 8 s recording. “A”–“D” indicate subpopulations of spikes attributed to neurons A, B, C and D. Differences between the indicated data points were statistically checked by the unpaired Student's t test, *p<0.05; **p<0.01. Error bars represent s.e.m.

References

    1. Buck L, Axel R. A novel multigene family may encode odorant receptors: a molecular basis for odor recognition. Cell. 1991;65:175–187. - PubMed
    1. Firestein S. How the olfactory system makes sense of scents. Nature. 2001;413:211–218. - PubMed
    1. Ronnett GV, Moon C. G proteins and olfactory signal transduction. Annu Rev Physiol. 2002;64:189–222. - PubMed
    1. Vosshall LB, Wong AM, Axel R. An olfactory sensory map in the fly brain. Cell. 2000;102:147–159. - PubMed
    1. Nei M, Niimura Y, Nozawa M. The evolution of animal chemosensory receptor gene repertoires: roles of chance and necessity. Nat Rev Genet. 2008;9:951–963. - PubMed

Publication types

MeSH terms

LinkOut - more resources