. 2011 Apr 7;6(4):e18586.
doi: 10.1371/journal.pone.0018586.

Some secrets of fluorescent proteins: distinct bleaching in various mounting fluids and photoactivation of cyan fluorescent proteins at YFP-excitation

Affiliations

Some secrets of fluorescent proteins: distinct bleaching in various mounting fluids and photoactivation of cyan fluorescent proteins at YFP-excitation

Naila Malkani et al. PLoS One. .

Abstract

Background: The use of spectrally distinct variants of green fluorescent protein (GFP) such as cyan or yellow mutants (CFP and YFP, respectively) is very common in all different fields of life sciences, e.g. for marking specific proteins or cells or to determine protein interactions. In the latter case, the quantum physical phenomenon of fluorescence resonance energy transfer (FRET) is exploited by specific microscopy techniques to visualize proximity of proteins.

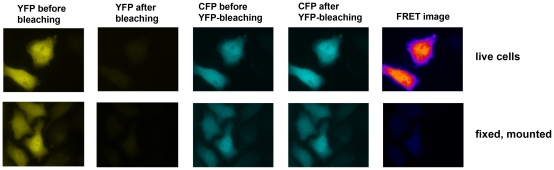
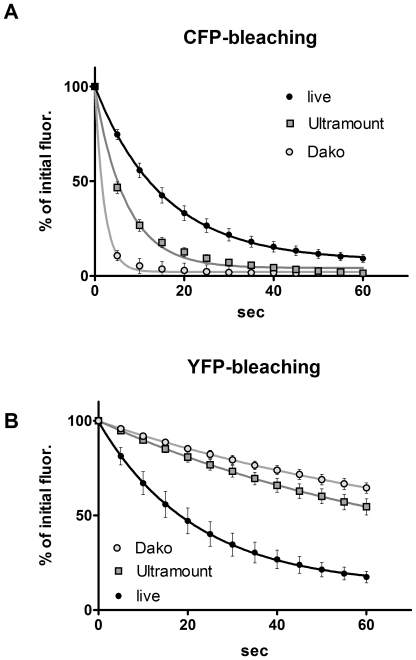
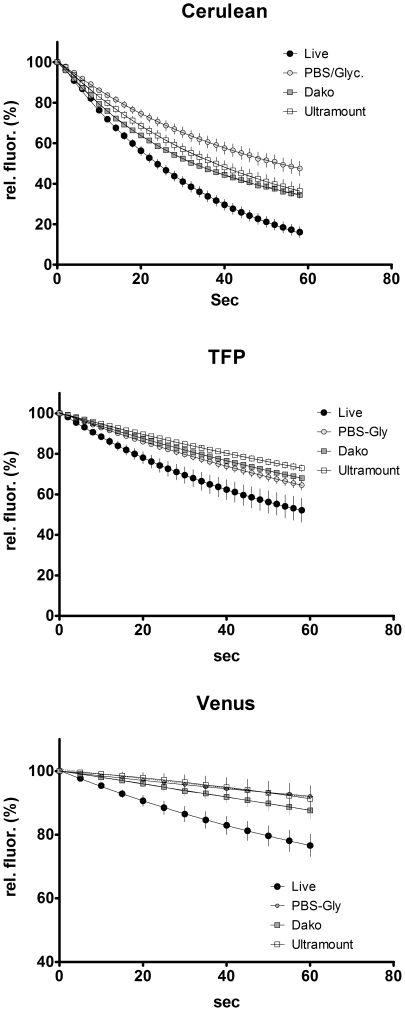
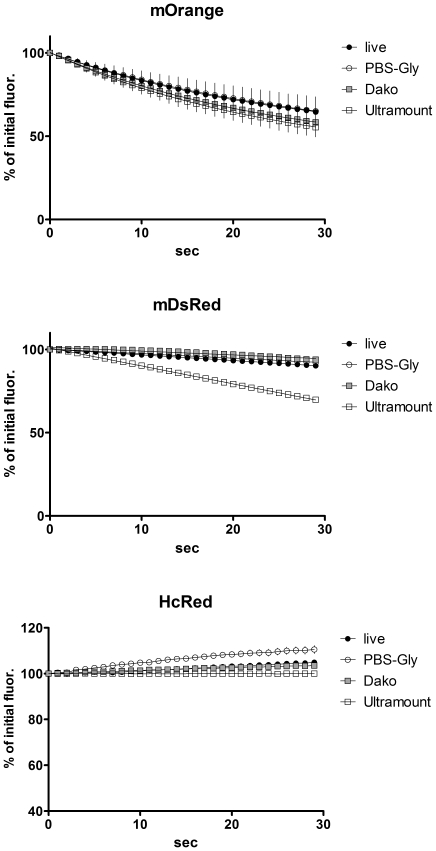
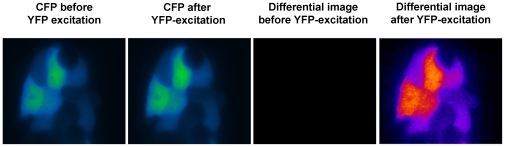
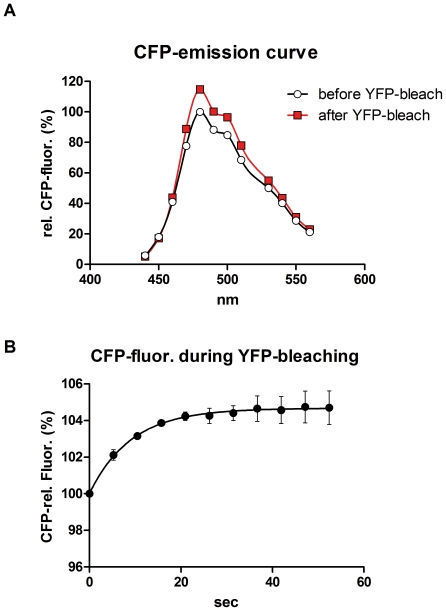
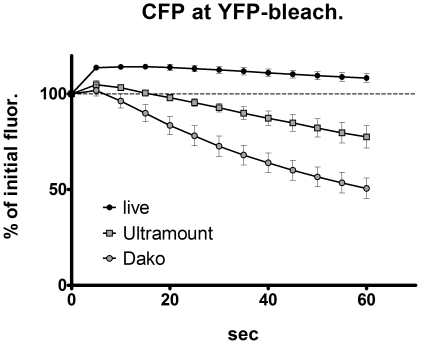
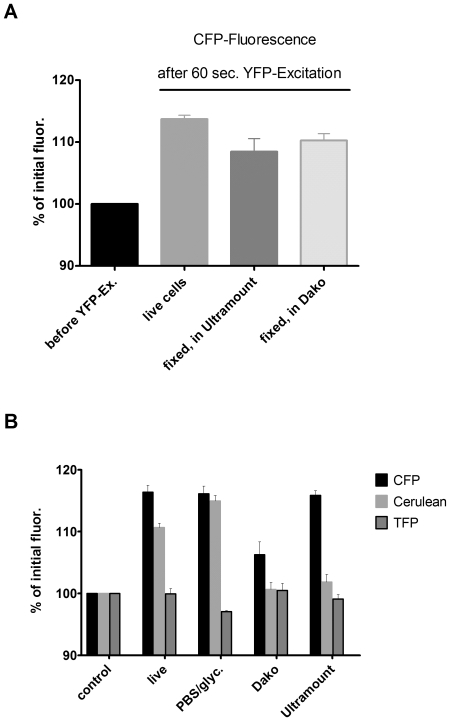
Methodology/principal findings: When we applied a commonly used FRET microscopy technique--the increase in donor (CFP)-fluorescence after bleaching of acceptor fluorophores (YFP), we obtained good signals in live cells, but very weak signals for the same samples after fixation and mounting in commercial microscopy mounting fluids. This observation could be traced back to much faster bleaching of CFP in these mounting media. Strikingly, the opposite effect of the mounting fluid was observed for YFP and also for other proteins such as Cerulean, TFP or Venus. The changes in photostability of CFP and YFP were not caused by the fixation but directly dependent on the mounting fluid. Furthermore we made the interesting observation that the CFP-fluorescence intensity increases by about 10-15% after illumination at the YFP-excitation wavelength--a phenomenon, which was also observed for Cerulean. This photoactivation of cyan fluorescent proteins at the YFP-excitation can cause false-positive signals in the FRET-microscopy technique that is based on bleaching of a yellow FRET acceptor.

Conclusions/significance: Our results show that photostability of fluorescent proteins differs significantly for various media and that CFP bleaches significantly faster in commercial mounting fluids, while the opposite is observed for YFP and some other proteins. Moreover, we show that the FRET microscopy technique that is based on bleaching of the YFP is prone to artifacts due to photoactivation of cyan fluorescent proteins under these conditions.


Conflict of interest statement

Competing Interests: The authors have declared that no competing interests exist.

Figures

Figure 1
Figure 1. Donor recovery FRET microscopy of live and fixed cells.
293 cells were transfected with a CFP-YFP fusion protein (ECYFP) representing a positive FRET sample and imaged as described , either as live cells or after fixation and mounting with Dako Fluorescence Mounting Fluid. In brief, a CFP-image was acquired, followed by bleaching of YFP and acquisition of a second CFP-image. An increase in CFP-signal upon YFP-bleaching is indicated by a pseudo-colored difference image (FRET image), which appeared much more intense for live cells than for fixed, mounted cells imaged under the same conditions. The pseudocolored difference image is shown in a “fire” look-up table, which emphasizes the signal intensity differences between live and fixed cells. It does not show absolute values.
Figure 2
Figure 2. Differential bleaching kinetics of CFP and YFP in different fluids.
293 cells were transfected with either CFP (A) or YFP (B) and the bleaching of the fluorescent proteins was recorded either for live cells in medium or for fixed cells after mounting in Fisher Scientific Ultramount (Ultramount) or Dako Fluorescence Mounting Fluid (Dako). Bleaching was recorded on a Zeiss Axiovert 135 microscope using continuous illumination at the respective wavelength with 50% energy of a 100W Mercury-lamp. Metamorph™ 7.5 software was used to acquire images at 5 sec intervals. Camera: PhotometricsCoolsnap; exposure time: 50 msec. Data points are mean of n = 4. Error bars represent standard error of mean (SEM).
Figure 3
Figure 3. Bleaching kinetics of Cerulean, teal fluorescent protein (TFP) and Venus in various mounting fluids.
293 cells were transfected with the different fluorescent protein constructs and imaged either live or after fixation and mounting as specified in Fig. 2 with 2 sec time intervals. Data points are mean of n = 5; error bars represent SEM.
Figure 4
Figure 4. Bleaching kinetics of mOrange, mDsRed and HcRed1 in different mounting fluids.
293 cells were transfected with the different fluorescent protein constructs and imaged either live or after fixation and mounting as specified in Fig. 2. Time intervals: 1 sec. Data points are mean of n = 7; error bars represent SEM.
Figure 5
Figure 5. Photoactivation of CFP by illumination at the YFP-excitation wavelength on a conventional epifluorescence microscope.
293 cells were transfected with CFP and imaged as live cells on a conventional epifluorescence microscope (Zeiss Axiovert 135) with a standard CFP filter as specified in the Methods section. After the first CFP-image, the cells were excited with the YFP-specific excitation light (500 nm) for 5 sec, followed by another CFP-image with the same acquisition settings as the first one. The two images are presented in a “Green Fire Blue” pseudocolour lookup table using ImageJ software to emphasize the difference in fluorescence intensity (designated as CFP before and after YFP-excitation, respectively). A differential image was calculated with ImageJ for two CFP-images before YFP-excitation and for a CFP-image after YFP-excitation minus a CFP-image before YFP-excitation (Differential image after YFP-excitation). These two images are shown in a “Fire” lookup table to emphasize the difference between the two differential images.
Figure 6
Figure 6. Photoactivation of CFP by illumination at the YFP-excitation wavelength on a confocal laser scanning microscope.
A) 293 cells expressing CFP were fixed and mounted in PBS/glycerol followed by spectral imaging on a Leica TCS SP5 confocal microscope. Emission curves were acquired with 405 nm laser excitation before and after strong illumination of a region of interest with the 514 nm laser line (50 iterative scans with 50% laser intensity) to mimic bleaching of YFP. The fluorescence intensity was quantified for the region of interest and normalized to the CFP-peak before YFP-bleaching. B) Time course of CFP-fluorescence upon YFP-bleaching by laser scanning. 293 cells expressing CFP were fixed and mounted in PBS/glycerol (1∶7) followed by imaging on a Leica TCS SP5 laser scanning microscope. Cells were imaged repetitively with 405 nm excitation and CFP-filter sets interrupted by intermediate illumination of a region of interest with 514 nm laser (50% laser power, 50 iterative scans). The intensity of the CFP-fluorescence was quantified in this region and is shown as percentage of the initial fluorescence. Error bars represent SEM.
Figure 7
Figure 7. Time course of CFP-fluorescence upon YFP-bleaching by conventional microscopy in different fluids.
293 cells were transfected with CFP alone and the time course of CFP-fluorescence was recorded with intermediate repetitive YFP-excitation either for live cells in medium or for fixed cells after mounting in Fisher Scientific Ultramount (Ultramount) or Dako Fluorescence Mounting Fluid (Dako) using a conventional epifluorescence microscope (as described in Fig. 2). A computer-controlled Ludl filter wheel was applied to switch from the continuous YFP-excitation briefly to CFP-excitation for capturing a CFP-signal (camera: PhotometricsCoolsnap; exposure time: 50 msec). Data points are mean of n = 3; error bars represent SEM.
Figure 8
Figure 8. Increase of CFP- or Cerulean fluorescence by YFP-excitation in different fluids (without repetitive CFP-excitation).
A) 293 cells expressing CFP alone were quickly imaged for CFP-fluorescence on a Zeiss Axiovert 135 microscope equipped with Ludl-filter wheels controlled by Metamorph 7.5-software, followed by an immediate switch to the YFP-excitation wavelength (500 nm) for 60 sec (50% power of a 100W mercury lamp) and the acquisition of a second CFP-image using the same image acquisition parameters. CFP-fluorescence is expressed as percentage of the initial fluorescence (before YFP-Ex.) and shown after YFP-excitation for live cells, fixed cells mounted in Ultramount or fixed cells mounted in Dako Fluorescence Mounting Fluid. B) 293 cells expressing either CFP, Cerulean or TFP alone were imaged quickly for cyan fluorescence as in A) followed by a fast switch to the YFP excitation wavelength for 5 sec (at 50% power of a 100W mercury lamp) and the acquisition of a second cyan fluorescence image. Data is shown as in A) for live cells or fixed cells mounted in PBS/glycerol (PBS/glyc.), Dako or Ultramount fluorescent mounting fluid as indicated. Error bars represent SEM; n = 7.

Similar articles

Cited by

References

    1. Tsien RY. THE GREEN FLUORESCENT PROTEIN. Annual Review of Biochemistry. 1998;67:509–544. - PubMed
    1. Jares-Erijman EA, Jovin TM. FRET imaging. Nat Biotechnol. 2003;21:1387–1395. - PubMed
    1. Schmid JA, Sitte HH. Fluorescence resonance energy transfer in the study of cancer pathways. CurrOpinOncol. 2003;15:55–64. - PubMed
    1. Van Munster EB, Kremers GJ, Adjobo-Hermans MJ, Gadella TW., Jr Fluorescence resonance energy transfer (FRET) measurement by gradual acceptor photobleaching. JMicrosc. 2005;218:253–262. - PubMed
    1. Bastiaens PI, Majoul IV, Verveer PJ, Soling HD, Jovin TM. Imaging the intracellular trafficking and state of the AB5 quaternary structure of cholera toxin. Embo J. 1996;15:4246–4253. - PMC - PubMed

Publication types

MeSH terms

Substances