. 2011 Apr;7(4):e1001331.
doi: 10.1371/journal.ppat.1001331. Epub 2011 Apr 7.

The MARCH family E3 ubiquitin ligase K5 alters monocyte metabolism and proliferation through receptor tyrosine kinase modulation

Affiliations

The MARCH family E3 ubiquitin ligase K5 alters monocyte metabolism and proliferation through receptor tyrosine kinase modulation

Roshan Karki et al. PLoS Pathog. 2011 Apr.

Abstract

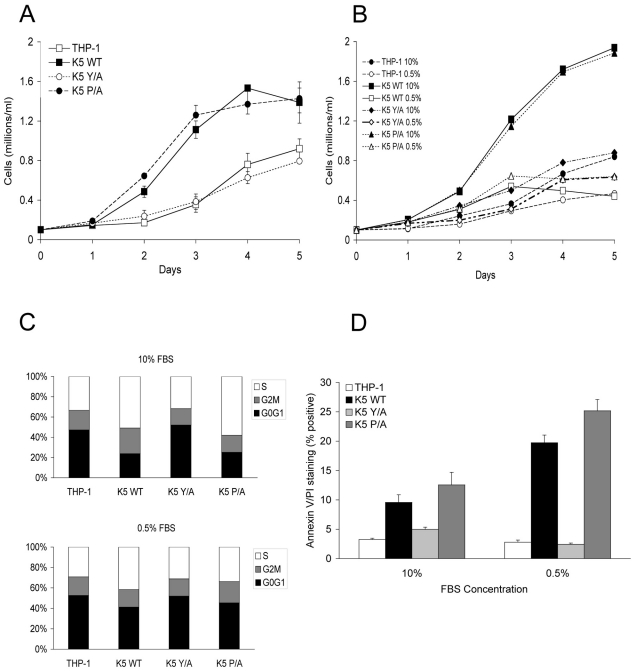
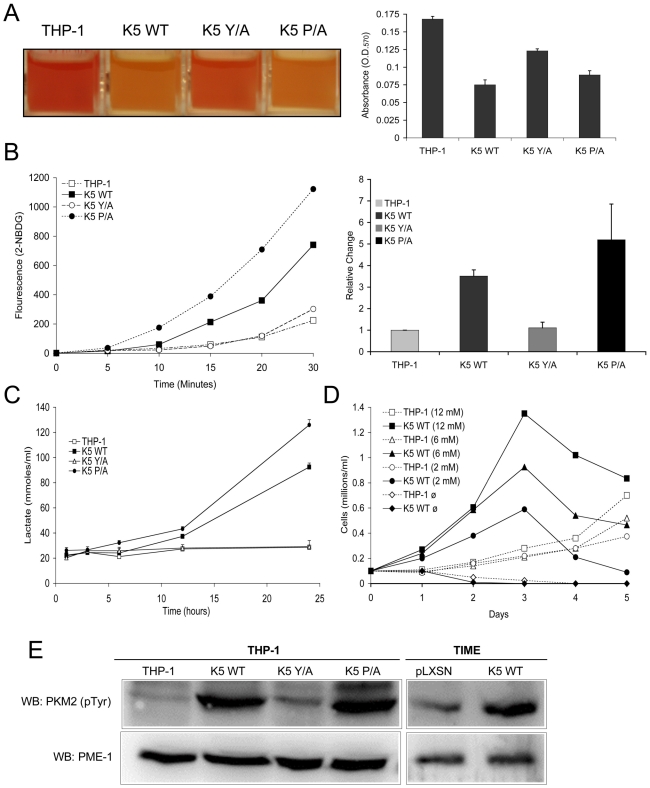
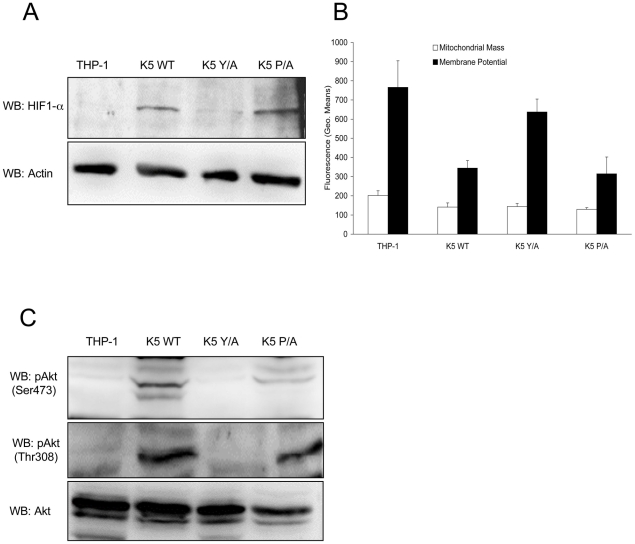
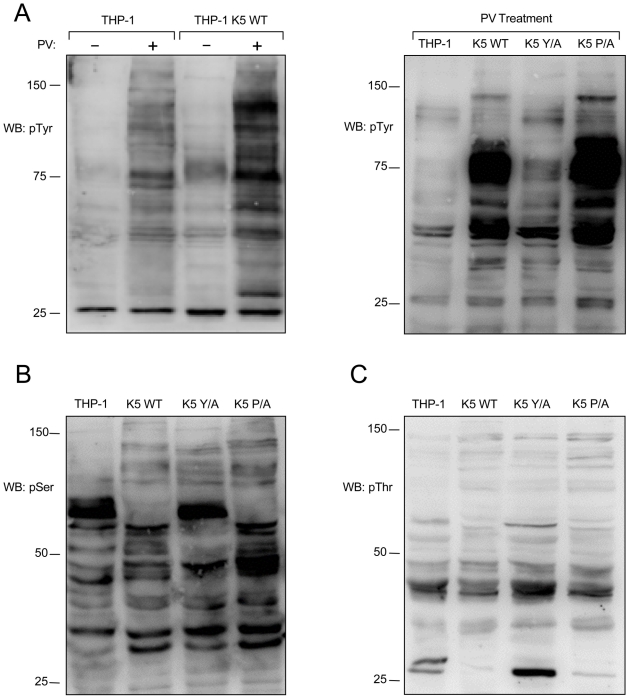
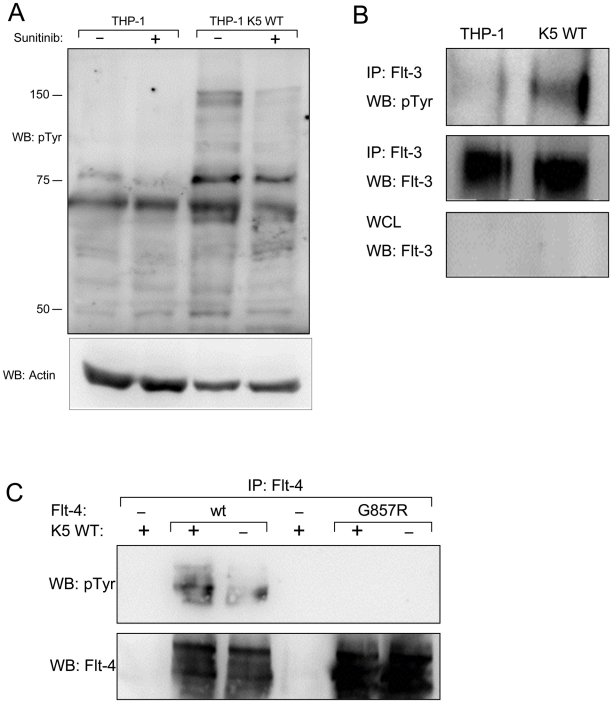
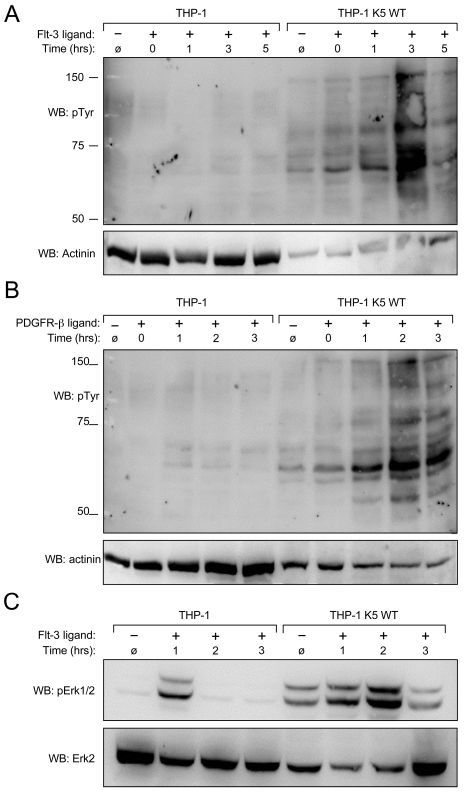
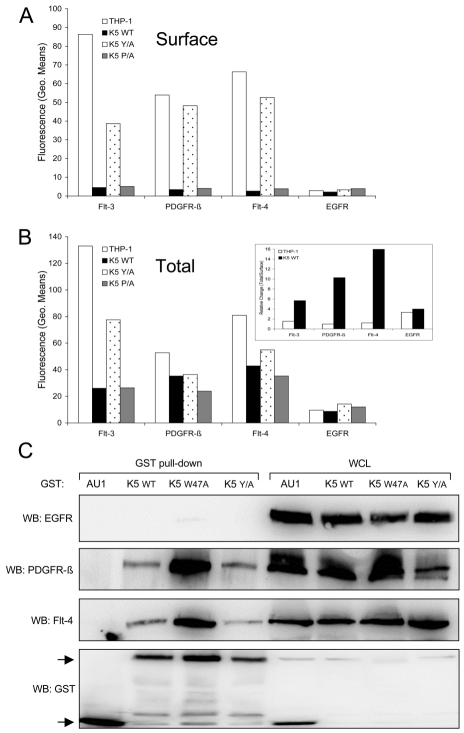
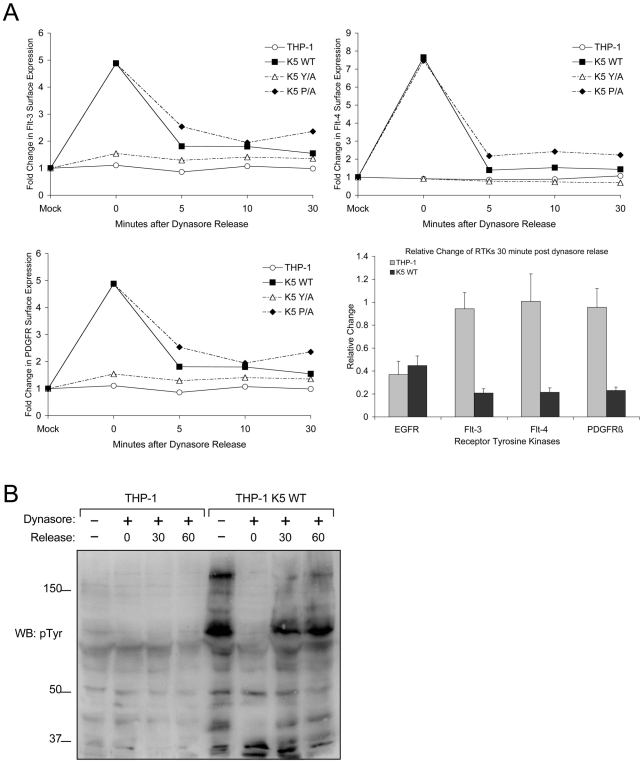
Kaposi's sarcoma (KS) lesions are complex mixtures of KS-associated herpesvirus (KSHV)-infected spindle and inflammatory cells. In order to survive the host immune responses, KSHV encodes a number of immunomodulatory proteins, including the E3 ubiquitin ligase K5. In exploring the role of this viral protein in monocytes, we made the surprising discovery that in addition to a potential role in down regulation of immune responses, K5 also contributes to increased proliferation and alters cellular metabolism. This ubiquitin ligase increases aerobic glycolysis and lactate production through modulation of cellular growth factor-binding receptor tyrosine kinase endocytosis, increasing the sensitivity of cells to autocrine and paracrine factors. This leads to an altered pattern of cellular phosphorylation, increases in Akt activation and a longer duration of Erk1/2 phosphorylation. Overall, we believe this to be the first report of a virally-encoded ubiquitin ligase potentially contributing to oncogenesis through alterations in growth factor signaling cascades and opens a new avenue of research in K5 biology.


Conflict of interest statement

The authors have declared that no competing interests exist.

Figures

Figure 1
Figure 1. THP-1 cells stably expressing wild-type K5 have increased growth rate, which is serum dependent.
THP-1 cell lines were seeded at 0.1 x 10⁶ cells/ml in RPMI media supplemented with (A) 10% FBS or (B) 5% and 0.5% FBS, as indicated, in triplicates. Viable cell numbers and averages were determined for each day. (C) Equal numbers of indicated THP-1 cell line in medium with either 10% FBS (top panel) or 0.5% FBS (bottom panel), were examined for cell cycle profile, as described in the Methods, at three days post-seeding. Results are representative of three independent experiments. (D) Each of the indicated THP-1 cells was seeded in triplicate at 0.1 x 10⁶ cells/ml in medium containing the indicated serum concentration. Five days post-seeding cells were examined for apoptosis. The percentage of cells doubly stained for Annexin V and propidium iodide are indicated.
Figure 2
Figure 2. THP-1 and TIME cells stably expressing wild-type K5 have an altered metabolism.
(A) Medium from equal numbers of the indicated cells were examined at 3 days post-seeding both visually (left panel) and for absorbance at 570 nm (O.D.570) (right panel) (B) Equal numbers of each THP-1 cell line were starved for 3 hours and incubated in glucose free DMEM medium with a fluorescent glucose analog (2-NBDG) (0.1 mM) for a period of 30 minutes. Live cells were gated and the fluorescence intensity assessed by flow cytometry at the indicated time points. A representative experiment of analog uptake (left panel) and the quantification of fold change after 30 min. with standard deviations (right panel) are shown. (C) Cells were seeded in triplicate at 0.1 x 10⁶ cells/ml and supernatant was taken at the indicated time points and subjected to colorimetric measurement of lactate concentration. (D) Cells were seeded at 0.1 x 10⁶ cells/ml in glucose-free DMEM media supplemented with different concentrations of glucose (12 mM, 6 mM, 2 mM or 0 mM). Viable cell numbers were determined daily. Data are representative of three experiments. (E) Normalized whole cell lysate of each of the indicated THP-1 and TIME cell lines were subject to western blot (WB) using an anti-phospho-PKM2 (Tyr 105) antibody and re-probed with anti-PME-1 antibodies.
Figure 3
Figure 3. K5 expressing cells have other features of the Warburg Effect.
(A) Normalized whole cell lysate of each of the indicated THP-1 cell lines were subject to western blot (WB) using an anti-HIF-1α antibody (top panel) and re-probed with anti-ß-actin antibodies (bottom panel). (B) Equal numbers of the indicated cell lines were stained with mitotracker green (Mitochondrial Mass) or mitotracker red (Membrane Potential) and subjected to flow cytometric analysis. (C) Normalized whole cell lysates were subjected to western blot (WB) using anti-phospho-Akt (Ser473) (top panel), anti-phospho-Akt (Thr308) (middle panel) or total Akt (bottom panel) antibodies. Data for all panels are representative of three independent experiments.
Figure 4
Figure 4. K5 alters tyrosine, serine and threonine phosphorylation.
(A, left panel) Vector- and K5 WT-expressing THP-1 cells were mock (-) or pervanadate (PV) treated for ten minutes and normalized whole cell lysates were subjected to western blot (WB) using an anti-phospho-tyrosine (4G10) (pTyr) antibody. Normalized whole cell lysates from PV treated THP-1 cell lines, as indicated, were subjected to western blot using (A, right panel) anti-phospho-tyrosine (4G10) (pTyr), (B) anti-phospho-serine (pSer) or (C) anti-phospho-threonine (pThr) antibodies. Data for all panels are representative of three independent experiments.
Figure 5
Figure 5. THP-1 cells stably expressing K5 WT have sunitinib-sensitive increased RTK phosphorylation.
(A) Normalized whole cell lysates from THP-1 cells, mock (PBS) or sunitinib (2 µM) treated, were subjected to western blot using an anti-phospho-tyrosine (4G10) (pTyr) antibody (top panel) and reprobed with an anti-actin antibody (bottom panel) to demonstrate equal loading. (B) Normalized WCL from parental or K5 WT-expressing THP-1 cells were subject to immunoprecipitation (IP) using anti-Flt-3 antibodies followed by western blot (WB) using an anti-phospho-tyrosine (4G10) (pTyr) antibody (top panel). The IP (middle panel)and whole cell lysates (WCL) (bottom panel) were probed with anti-Flt-3 antibodies, as controls. (C) 293T cells were co-transfected with expression constructs for K5 and Flt-4 or a Flt-4 mutant (G857R). Two days post-transfection, cell lysates were subjected to IP using anti-Flt-4 antibodies. western blot (WB) was performed using anti-phospho-tyrosine (4G10) (pTyr) antibodies (top panel) and re-probed with anti-Flt-4 antibodies (bottom panel). Data for all panels are representative of three independent experiments.
Figure 6
Figure 6. K5 WT-THP-1 cells are more responsive to Flt-3 and PDGF-ß-induced signaling and have increased Erk activation.
Equal numbers of vector- and K5 WT-expressing THP-1 cells were serum starved overnight and stimulated with (A and C) Flt-3L (40 ng/ml) or (B) PDGF-ß (20 ng/ml) for ten minutes after which cells were washed and then treated with pervanadate for ten minutes at the times indicated. Western blot (WB) was performed on normalized whole cell lysates using (A and B) anti-phospho-tyrosine (4G10) (pTyr) or (C) anti-phospho-Erk antibodies. For panels A and B, 10 ug of THP-1 K5 WT lysate and 30 ug of THP-1 lysate were loaded to make comparison of bands easier between the two cell lines. Equal amounts of each lysate, 30 ug/lane, were loaded for panel C. Blots were re-probed for actinin (A and B) or total Erk (C). Data are representative of three independent experiments.
Figure 7
Figure 7. K5 interacts with and alters RTK localization.
Equal cell numbers of the indicated THP-1 lines were fixed with paraformaldehyde (PFA) and (A) stained without permeabilization to determine surface expression or (B) permeabilized with saponin prior to staining to determine total expression of Flt-4, PDGFR-ß, Flt-3 and EGFR by flow cytometry. Data are representative of three independent experiments. (B, Inset) The relative ratio of surface versus total RTKs was determined for vector- and K5 WT-expressing THP-1 cells. (C) 293T cells were co-transfected with expression constructs for EGFR, PDGFR-ß, or Flt-4 and the indicated GST expression constructs. After two days, lysates were subjected to GST pull-down using glutathione-sepharose beads. Purified proteins and whole cell lysates (WCL) were subjected to western blot (WB) using anti-EGFR, -Flt-4 or -PDGFR-ß antibodies, followed by re-probing with anti-GST antibodies. Arrows indicate GST or GST-K5 WT and mutant specific bands. Data are representative of three independent experiments.
Figure 8
Figure 8. K5 mediates rapid internalization of RTKs from the surface leading to increased signaling.
(A) Equal numbers of the indicated THP-1 lines were mock or Dynasore (80 µM) treated for an hour at 37°C. Cells were then released at 37°C in serum free media for 0, 5, 10 or 30 minutes. At the indicated time points, cell aliquots were fixed and stained for surface levels of Flt-3, Flt-4 and PDGFR-ß followed by flow cytometric analysis. Representative experiments for each of the three receptors demonstrating the relative change in the expression of each RTK normalized to the fluorescence (geometric means) of mock treated samples is shown as line graphs, while the overall endocytosis rate of the receptor tyrosine kinases over the 30 minutes following dynasore release normalized to the time 0 point is shown as a bar graph with standard deviations. Line graph results are representative of at least three experiments (B) Equal numbers of vector- and K5 wt-expressing THP-1 were seeded in media containing 2% FBS. Following treatment with DMSO (mock) or Dynasore (80 µM) for 60 min and release in Dynasore-free medium at 37°C for 0, 30 or 60 minutes normalized whole cell lysates were prepared and subjected to western blot (WB) with an anti-phospho-tyrosine (4G10) (pTyr) antibody.

Similar articles

Cited by

References

    1. Gatenby RA, Gillies RJ. Why do cancers have high aerobic glycolysis? Nat Rev Cancer. 2004;4:891–899. - PubMed
    1. DeBerardinis RJ, Cheng T. Q's next: the diverse functions of glutamine in metabolism, cell biology and cancer. Oncogene. 2010;29:313–324. - PMC - PubMed
    1. Koukourakis MI, Giatromanolaki A, Harris AL, Sivridis E. Comparison of metabolic pathways between cancer cells and stromal cells in colorectal carcinomas: a metabolic survival role for tumor-associated stroma. Cancer Res. 2006;66:632–637. - PubMed
    1. Cesarman E, Chang Y, Moore PS, Said JW, Knowles DM. Kaposi's sarcoma-associated herpesvirus-like DNA sequences in AIDS-related body-cavity-based lymphomas. N Engl J Med. 1995;332:1186–1191. - PubMed
    1. Chang Y, Cesarman E, Pessin MS, Lee F, Culpepper J, et al. Identification of herpesvirus-like DNA sequences in AIDS-associated Kaposi's sarcoma. Science. 1994;266:1865–1869. - PubMed

Publication types