Brain abnormalities and glioma-like lesions in mice overexpressing the long isoform of PDGF-A in astrocytic cells
- PMID: 21490965
- PMCID: PMC3072383
- DOI: 10.1371/journal.pone.0018303
Brain abnormalities and glioma-like lesions in mice overexpressing the long isoform of PDGF-A in astrocytic cells
Abstract
Background: Deregulation of platelet-derived growth factor (PDGF) signaling is a hallmark of malignant glioma. Two alternatively spliced PDGF-A mRNAs have been described, corresponding to a long (L) and a short (S) isoform of PDGF-A. In contrast to PDGF-A(S), the PDGF-A(L) isoform has a lysine and arginine rich carboxy-terminal extension that acts as an extracellular matrix retention motif. However, the exact role of PDGF-A(L) and how it functionally differs from the shorter isoform is not well understood.
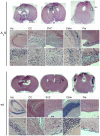
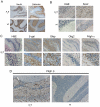
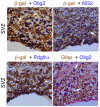
Methodology/principal findings: We overexpressed PDGF-A(L) as a transgene under control of the glial fibrillary acidic protein (GFAP) promoter in the mouse brain. This directs expression of the transgene to astrocytic cells and GFAP expressing neural stem cells throughout the developing and adult central nervous system. Transgenic mice exhibited a phenotype with enlarged skull at approximately 6-16 weeks of age and they died between 1.5 months and 2 years of age. We detected an increased number of undifferentiated cells in all areas of transgene expression, such as in the subependymal zone around the lateral ventricle and in the cerebellar medulla. The cells stained positive for Pdgfr-α, Olig2 and NG2 but this population did only partially overlap with cells positive for Gfap and the transgene reporter. Interestingly, a few mice presented with overt neoplastic glioma-like lesions composed of both Olig2 and Gfap positive cell populations and with microvascular proliferation, in a wild-type p53 background.
Conclusions: Our findings show that PDGF-A(L) can induce accumulation of immature cells in the mouse brain. The strong expression of NG2, Pdgfr-α and Olig2 in PDGF-A(L) brains suggests that a fraction of these cells are oligodendrocyte progenitors. In addition, accumulation of fluid in the subarachnoid space and skull enlargement indicate that an increased intracranial pressure contributed to the observed lethality.
Conflict of interest statement
Figures


Similar articles
-
Retroviral delivery of platelet-derived growth factor to spinal cord progenitor cells drives the formation of intramedullary gliomas.Neurosurgery. 2012 Jan;70(1):198-204; discussion 204. doi: 10.1227/NEU.0b013e31822ce963. Neurosurgery. 2012. PMID: 21760556 Free PMC article.
-
Astrocytes and oligodendrocytes can be generated from NG2+ progenitors after acute brain injury: intracellular localization of oligodendrocyte transcription factor 2 is associated with their fate choice.Eur J Neurosci. 2009 May;29(9):1853-69. doi: 10.1111/j.1460-9568.2009.06736.x. Epub 2009 Apr 28. Eur J Neurosci. 2009. PMID: 19473238
-
PDGF autocrine stimulation dedifferentiates cultured astrocytes and induces oligodendrogliomas and oligoastrocytomas from neural progenitors and astrocytes in vivo.Genes Dev. 2001 Aug 1;15(15):1913-25. doi: 10.1101/gad.903001. Genes Dev. 2001. PMID: 11485986 Free PMC article.
-
GFAP Alternative Splicing and the Relevance for Disease - A Focus on Diffuse Gliomas.ASN Neuro. 2022 Jan-Dec;14:17590914221102065. doi: 10.1177/17590914221102065. ASN Neuro. 2022. PMID: 35673702 Free PMC article. Review.
-
Harnessing OLIG2 function in tumorigenicity and plasticity to target malignant gliomas.Cell Cycle. 2017 Sep 17;16(18):1654-1660. doi: 10.1080/15384101.2017.1361062. Epub 2017 Aug 14. Cell Cycle. 2017. PMID: 28806136 Free PMC article. Review.
Cited by
-
FoxM1 Drives a Feed-Forward STAT3-Activation Signaling Loop That Promotes the Self-Renewal and Tumorigenicity of Glioblastoma Stem-like Cells.Cancer Res. 2015 Jun 1;75(11):2337-48. doi: 10.1158/0008-5472.CAN-14-2800. Epub 2015 Apr 1. Cancer Res. 2015. PMID: 25832656 Free PMC article.
-
PDGF and PDGF receptors in glioma.Ups J Med Sci. 2012 May;117(2):99-112. doi: 10.3109/03009734.2012.665097. Epub 2012 Apr 17. Ups J Med Sci. 2012. PMID: 22509804 Free PMC article. Review.
-
Most human non-GCIMP glioblastoma subtypes evolve from a common proneural-like precursor glioma.Cancer Cell. 2014 Aug 11;26(2):288-300. doi: 10.1016/j.ccr.2014.06.005. Cancer Cell. 2014. PMID: 25117714 Free PMC article.
-
Platelet-derived growth factor receptor alpha in glioma: a bad seed.Chin J Cancer. 2011 Sep;30(9):590-602. doi: 10.5732/cjc.011.10236. Chin J Cancer. 2011. PMID: 21880180 Free PMC article. Review.
-
Glioblastoma Multiforme Stem Cell Cycle Arrest by Alkylaminophenol Through the Modulation of EGFR and CSC Signaling Pathways.Cells. 2020 Mar 10;9(3):681. doi: 10.3390/cells9030681. Cells. 2020. PMID: 32164385 Free PMC article.
References
-
- Fredriksson L, Li H, Eriksson U. The PDGF family: four gene products form five dimeric isoforms. Cytokine Growth Factor Rev. 2004;15:197–204. - PubMed
-
- Heldin CH, Westermark B. Mechanism of action and in vivo role of platelet-derived growth factor. Physiol Rev. 1999;79:1283–1316. - PubMed
-
- Andersson M, Ostman A, Westermark B, Heldin CH. Characterization of the retention motif in the C-terminal part of the long splice form of platelet-derived growth factor A-chain. J Biol Chem. 1994;269:926–930. - PubMed
Publication types
MeSH terms
Substances
LinkOut - more resources
Full Text Sources
Molecular Biology Databases
Research Materials
Miscellaneous

