. 2011 Apr 7;6(4):e18088.
doi: 10.1371/journal.pone.0018088.

Identification of a gene regulatory network necessary for the initiation of oligodendrocyte differentiation

Affiliations

Identification of a gene regulatory network necessary for the initiation of oligodendrocyte differentiation

Victoria A Swiss et al. PLoS One. .

Abstract

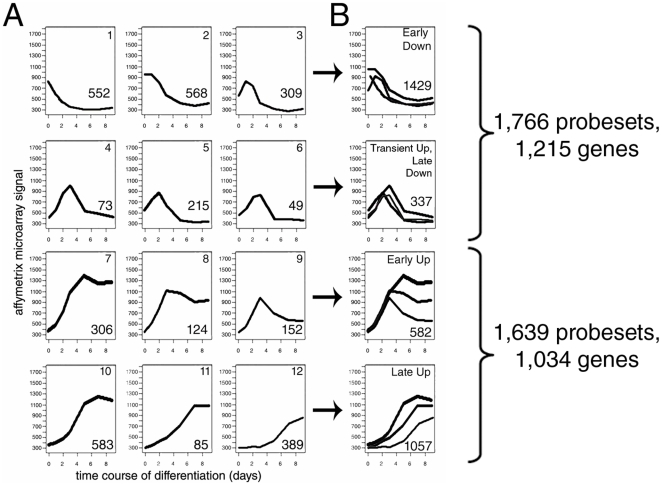
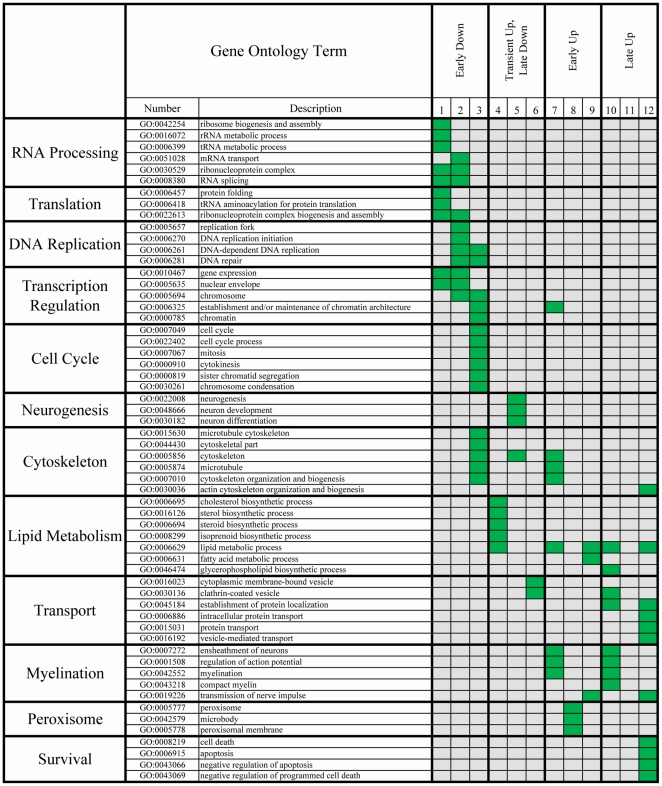
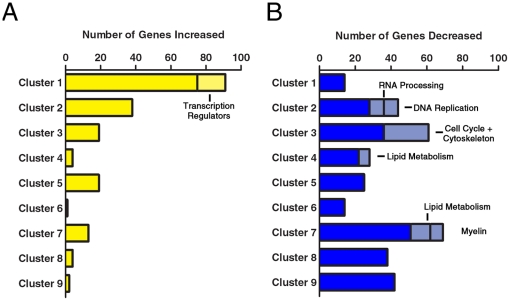
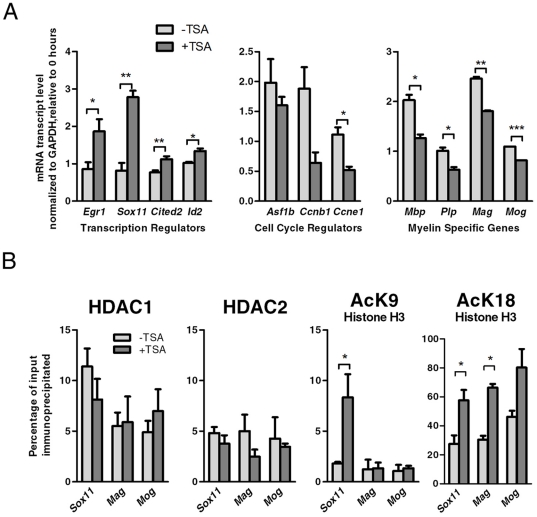
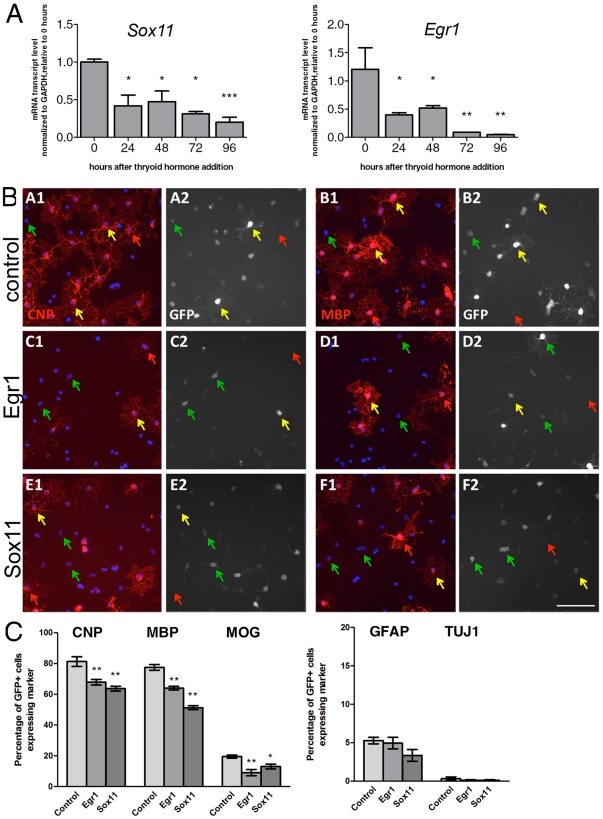
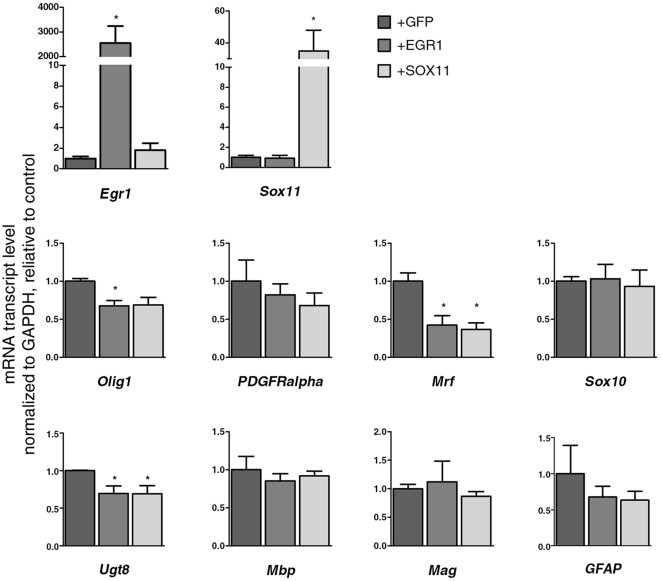
Differentiation of oligodendrocyte progenitor cells (OPCs) into mature oligodendrocytes requires extensive changes in gene expression, which are partly mediated by post-translational modifications of nucleosomal histones. An essential modification for oligodendrocyte differentiation is the removal of acetyl groups from lysine residues which is catalyzed by histone deacetylases (HDACs). The transcriptional targets of HDAC activity within OPCs however, have remained elusive and have been identified in this study by interrogating the oligodendrocyte transcriptome. Using a novel algorithm that allows clustering of gene transcripts according to expression kinetics and expression levels, we defined major waves of co-regulated genes. The initial overall decrease in gene expression was followed by the up-regulation of genes involved in lipid metabolism and myelination. Functional annotation of the down-regulated gene clusters identified transcripts involved in cell cycle regulation, transcription, and RNA processing. To define whether these genes were the targets of HDAC activity, we cultured rat OPCs in the presence of trichostatin A (TSA), an HDAC inhibitor previously shown to inhibit oligodendrocyte differentiation. By overlaying the defined oligodendrocyte transcriptome with the list of 'TSA sensitive' genes, we determined that a high percentage of 'TSA sensitive' genes are part of a normal program of oligodendrocyte differentiation. TSA treatment increased the expression of genes whose down-regulation occurs very early after induction of OPC differentiation, but did not affect the expression of genes with a slower kinetic. Among the increased 'TSA sensitive' genes we detected several transcription factors including Id2, Egr1, and Sox11, whose down-regulation is critical for OPC differentiation. Thus, HDAC target genes include clusters of co-regulated genes involved in transcriptional repression. These results support a de-repression model of oligodendrocyte lineage progression that relies on the concurrent down-regulation of several inhibitors of differentiation.


Conflict of interest statement

Competing Interests: The authors have declared that no competing interests exist.

Figures

Figure 1
Figure 1. Clustering of co-expressed genes during oligodendrocyte differentiation.
A. Microarray probes whose levels changed by ≥2 fold during oligodendrocyte differentiation were grouped into co-expressed clusters depending on their expression kinetics during the entire time course of differentiation. Note that the raw values were analyzed over time and they were not normalized against reference genes. Each gene cluster is represented by a graph displaying the average expression level (y-axis) over the entire course of oligodendrocyte differentiation (x-axis). Cluster ID numbers are in the upper corner of each graph and the number of probes within each cluster is found in the lower right of each graph. B. Clusters were further grouped together to define ‘early down’, ‘transient up, late down’, ‘early up’ and ‘late up’ groups. The total number of probesets and genes is listed on the right.
Figure 2
Figure 2. Co-expressed genes have similar biological functions.
Each cluster of co-expressed genes was analyzed for ontology, as listed on the top of the chart. Non-redundant ontology terms were listed and are sub-categorized according to function. Terms with a statistically significant enrichment (p Value<10−3) above the background set (whole genome) are represented as a green box for each cluster.
Figure 3
Figure 3. HDAC inhibition in differentiating OPCs halts the transcriptional program of differentiation.
OPCs were differentiated for one day in the absence or presence of the HDAC inhibitor Trichostatin A (TSA), mRNA was extracted and analyzed by microarray analysis. TSA sensitive genes were overlapped onto the early oligodendrocyte transcriptome (clusters 1–9). A. The light yellow bar graphs represent the number of genes within each kinetically defined cluster which were increased by TSA treatment. B. The light blue bar graphs represent the number of genes which were decreased by TSA treatment. Groups of genes enriched in a particular ontology group are indicated and labeled.
Figure 4
Figure 4. HDAC activity directly regulates the expression of Sox11.
A. Quantitative RT-PCR was performed to validate changes of transcript levels for transcriptional regulators, cell cycle regulators and myelin specific genes in OPCs either untreated or treated with TSA for one day. The data reflect the results of qPCR results performed in duplicate from 2–4 independent biological replicates (* p<0.05; ** p<0.01, *** p<0.001 as determined by two-tailed t-test). B. Quantitative Chromatin Immunoprecipitation of samples collected from OPCs either untreated or treated with TSA and then immunoprecipitated with antibodies specific for HDAC1, HDAC2, acetylated lysine 9 on histone H3, and acetylated lysine 18 on histone H3. A mock immunoprecipiation was used (not shown) as a negative control. The experiment was oerformed in triplicate from two separate biological replicates. Data are represented as mean ± SEM, * p<0.05 as determined by two-tailed t-test.
Figure 5
Figure 5. Down regulation of Sox11 and Egr1 is important for normal oligodendrocyte progenitor differentiation.
A. Quantitative RT-PCR to measure Sox11 and Egr1 transcript levels in RNA samples isolated from OPCs differentiated for 0, 24, 48, 72, and 96 hours. Error bars ±S.E.M, ** p<0.001, * p<0.005 as determined by student two-tailed T-test. B. Images of purified P7 rat OPCs transfected with either pC1-eGFP alone (A-B, “control”), or co-transfected with either pSp-Egr1 (C–D) or pSp-Sox11 (E–F) expression vector. Transfected OPCs were cultured for 3 days in mitogen-free (-PDGF) medium to induce differentiation, and subsequently immunostained for GFP (white; A2-F2) plus either CNP (red; A1, C1, E1) or MBP (red; B1, D1, F1) and counterstained with DAPI (blue; A1-F1) to visualize nuclei. Yellow arrows indicate GFP+ transfected cells co-expressing CNP or MBP; green arrows indicate GFP+ cells negative for CNP or MBP expression; red arrows indicate untranfected cells expressing CNP or MBP. Scale bar  =  200 µm. C. Percentages of control (GFP-only), pSp-Egr1, and pSp-Sox11 transfected cells expressing the indicated oligodendrocyte specific markers (CNP, MBP, or MOG). Error bars ±S.E.M., n = 6–16 samples from 2–5 independent experiments, ** p<0.001, * p<0.005 post-hoc SNK test vs. control.
Figure 6
Figure 6. Over expression of Egr1 or Sox11 inhibits the expression of differentiation activators.
Quantitative RT-PCR of RNA samples collected from OPCs cultured as decribed in figure 5 and amplified with primers specific for Egr1 and Sox11 to validate over-expression. The transcript levels of oligodendrocyte lineage markers (PDGFRalpha, Olig1), transcriptional activators of OPC differentiation (Mrf, Sox10), myelin genes (Ugt8, Mbp, Mag), and of an astrocytic gene (Gfap) were measured in Egr1 or Sox11 over-expressing cells and compared to GFP over-expressors. Data are represented as mean ± SEM, from 3 independent experiments (*p<0.05 as determined by two-tailed t-test).

Similar articles

Cited by

References

    1. Fields RD. Oligodendrocytes changing the rules: action potentials in glia and oligodendrocytes controlling action potentials. Neuroscientist. 2008;14:540–543. - PMC - PubMed
    1. Baumann N, Pham-Dinh D. Biology of oligodendrocyte and myelin in the mammalian central nervous system. Physiol Rev. 2001;81:871–927. - PubMed
    1. Bradl M, Lassmann H. Oligodendrocytes: biology and pathology. Acta Neuropathol. 2010;119:37–53. - PMC - PubMed
    1. Gielen E, Baron W, Vandeven M, Steels P, Hoekstra D, et al. Rafts in oligodendrocytes: evidence and structure-function relationship. Glia. 2006;54:499–512. - PubMed
    1. Carson JH, Gao Y, Tatavarty V, Levin MK, Korza G, et al. Multiplexed RNA trafficking in oligodendrocytes and neurons. Biochim Biophys Acta. 2008;1779:453–458. - PMC - PubMed

Publication types

LinkOut - more resources