Comparative Study
. 2011 Jun;100(6):2071-86.
doi: 10.1002/jps.22432. Epub 2010 Dec 29.

The utility of hydrogen/deuterium exchange mass spectrometry in biopharmaceutical comparability studies

Affiliations
Comparative Study

The utility of hydrogen/deuterium exchange mass spectrometry in biopharmaceutical comparability studies

Damian Houde et al. J Pharm Sci. 2011 Jun.

Abstract

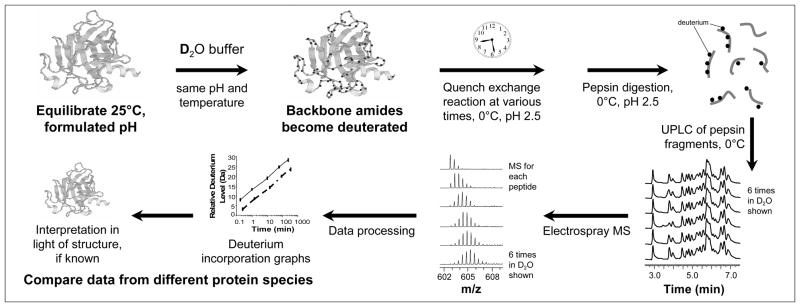
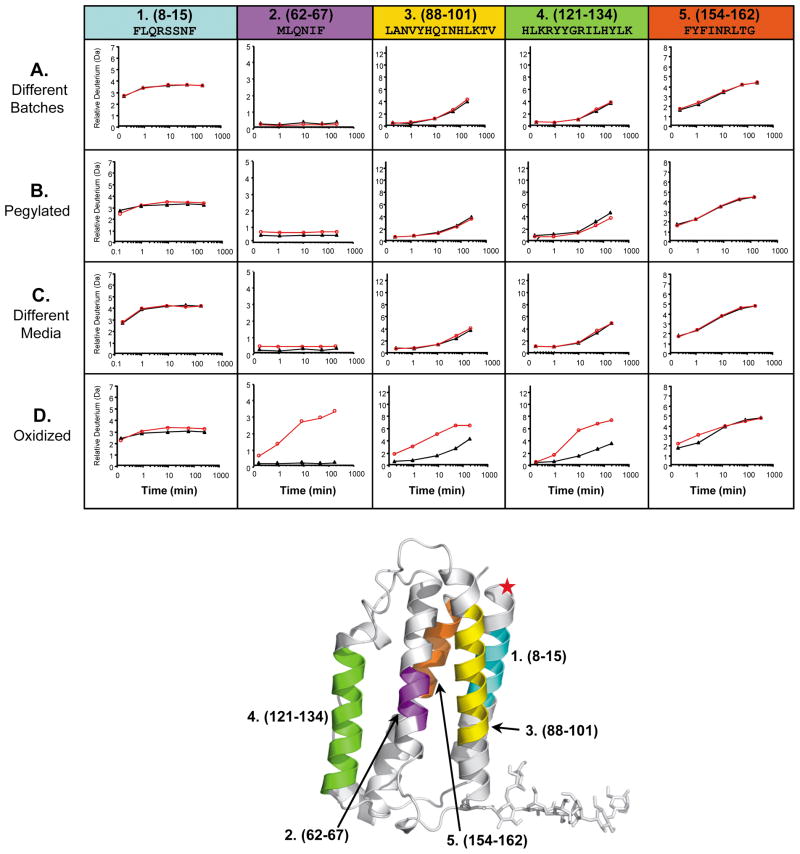
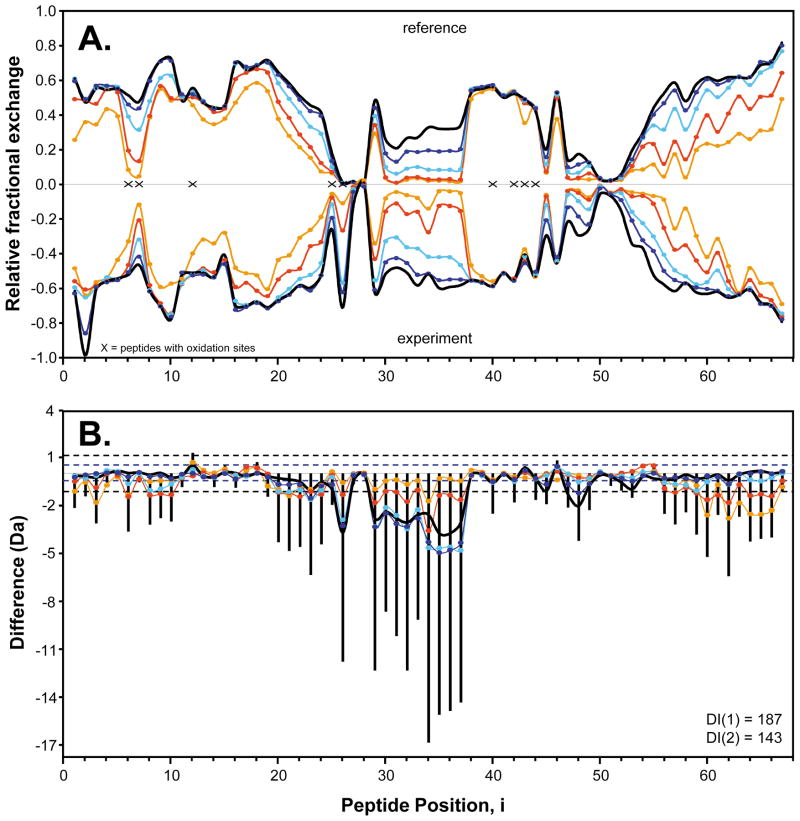
The function, efficacy, and safety of protein biopharmaceuticals are tied to their three-dimensional structure. The analysis and verification of this higher-order structure are critical in demonstrating manufacturing consistency and in establishing the absence of structural changes in response to changes in production. It is, therefore, essential to have reliable, high-resolution and high sensitivity biophysical tools capable of interrogating protein structure and conformation. Here, we demonstrate the use of hydrogen/deuterium exchange mass spectrometry (H/DX-MS) in biopharmaceutical comparability studies. H/DX-MS measurements can be conducted with good precision, consume only picomoles of protein, interrogate nearly the entire molecule with peptide level resolution, and can be completed in a few days. Structural comparability or lack of comparability was monitored for different preparations of interferon-β-1a. We present specific graphical formats for the display of H/DX-MS data that aid in rapidly making both the qualitative (visual) and quantitative assessment of comparability. H/DX-MS is capable of making significant contributions in biopharmaceutical characterization by providing more informative and confidant comparability assessments of protein higher-order structures than are currently available within the biopharmaceutical industry.


Figures

Figure 1
Figure 1
Representative workflow of a H/DX-MS experiment (used with permission, from Ref ). The protein sample is equilibrated to the desired temperature and diluted at least 10-fold into deuterated buffer (same composition as formulation buffer). The deuteration is allowed to progress and aliquots are taken at various times and quenched by lowering the pH to 2.5 and the temperature to 0 °C. These quenched samples are digested on-line with immobilized pepsin, the peptic peptides captured and separated with reversed-phase chromatography at 0 °C, and the mass of each peptide determined by mass spectrometry. The relative level of deuteration is plotted vs. time and samples are compared.
Figure 2
Figure 2
(A) Pepsin digestion coverage map of IFN. Each red bar under the sequence indicates an identified IFN peptic peptide that was monitored during all H/DX-MS experiments. These peptides cover 157 of the total 167 amino acid residues in IFN yielding a linear sequence coverage of 95%. (B) Left: Representative UPLC chromatography (TIC is shown) of a typical IFN H/DX-MS experiment with H/DX time points of 0, 10 seconds, 1, 10, 60 and 240 minutes. Right: Mass spectra of the peptide covering residues 8–15 (sequence FLQRSSNF) at the same time points, top to bottom, as shown in the left panel. The red arrow at ~5.6 minutes in the left panel indicates the retention time of this peptide.
Figure 3
Figure 3
A small subset of deuterium incorporation graphs generated for five IFN peptic peptides from four different IFN H/DX-MS comparability experiments. In each graph, the reference IFN data is the black line with closed triangles while the experimental IFN data, to which it is being compared, is the red line with open circles. Row A: comparison of two different large scale IFN batches prepared over 8 years apart; Row B: comparison of IFN versus N-terminally pegylated IFN; Row C: comparison of IFN produced using different cell culture media and growth conditions; Row D: comparison of IFN versus oxidized IFN (oxidation of Met and Cys residues C17, M1, M36, M62, M117 was 100% as indicated by LC/MS peptide mapping, data not shown). Columns 1–5 represent five (of the 67) different IFN peptic peptides that were identified and monitored in all IFN H/DX-MS comparison experiments. Each column (peptide) is designated with a specific color, shown at the top. The actual position of these peptides in the three-dimensional structure of IFN is shown with the same color code on the x-ray crystal structure of human IFN (PDB:1AU1 ) located at the bottom of the figure. A red star indicates the position of the pegylation.
Figure 4
Figure 4
Comparability profile of reference IFN versus experimental lot of IFN produced using different cell culture media and growth conditions. (A) Mirror plot of the average relative fractional exchange data for reference IFN (top) versus the experimental IFN (bottom), as a function of peptide “i” - note that the standard plotting scheme we have adopted is to have reference on top and experiment on the bottom of the mirror plot. Each point is an average of four separate and independent H/DX-MS comparison experiments. The orange, red, cyan, blue and black lines correspond to data acquired at 10 seconds, 1, 10, 60 and 240 minutes of deuteration, respectively, for both samples. The x-axis is the calculated peptide midpoint, i, position of each of the 67 peptides compared (see also Supporting Information and Figure S2). The y-axis is the average calculated relative fractional exchange, as described in the Experimental Section. (B) Plot of the H/DX-MS difference data described in the Experimental Section and calculated from the average data shown in Figure 4A, between reference IFN and experimental IFN. The orange, red, cyan, blue and black lines correspond to the average D(ΔMi,t) values calculated for H/DX-MS data acquired at 10 seconds, 1, 10, 60 and 240 minute time points, respectively (Each point is an average of the four separate and independent H/DX-MS comparison experiments from Fig 4A). The black vertical bar at each peptide “i” position along the x-axis is the average Ds(i) value for that peptide. The blue dotted lines at y-axis values ±0.5 Da represent the 98% confidence limit for D(ΔMi,t) data, while the black dotted lines at y-axis values ±1.1 Da represent the 98% confidence limit for Ds(i) data. DI(1) and DI(2) were calculated as described in the text.
Figure 5
Figure 5
The four individual H/DX-MS experiments (panels A-D) all acquired on the same day and used to calculate the average difference data in Figure 4B. See the legend to Figure 4 for descriptions of symbols, lines, and colors.
Figure 6
Figure 6
The effects of conducting H/DX-MS comparison experiments using data acquired on different days. These H/DX-MS difference data were obtained in the comparison of the IFN reference sample to itself, but analyzed on two different days (not consecutive). Comparing this plot with each of the single H/DX-MS experiments shown in Figure 5 indicates the quality of H/DX-MS inter-day data vs. intra-day data. See the legend to Figure 4 for descriptions of symbols, lines, and colors.
Figure 7
Figure 7
Comparability profile of reference IFN reference versus oxidized IFN. (A) Mirror plot of average relative fractional exchange data for IFN reference (top), versus oxidized IFN (bottom). These data are the average of three separate, independent comparison experiments. (B) Plot of the average H/DX-MS difference data calculated from the data shown in part A. See the legend to Figure 4 for descriptions of symbols, lines, and colors.

Similar articles

Cited by

References

    1. Lundblad RL. Approaches to the Conformational Analysis of Biopharmaceuticals. Boca Raton, FL: Chapman & Hall/CRC Press; 2009. Dec 15, p. 336.
    1. Rader RA. (Re)defining biopharmaceutical. Nat Biotechnol. 2008;26(7):743–751. - PubMed
    1. Zuñiga L, Calvo B. Biosimilars approval process. Regul Toxicol Pharmacol. 2010;56(3):374–377. - PubMed
    1. Schellekens H, Moors E. Clinical comparability and European biosimilar regulations. Nat Biotechnol. 2010;28(1):28–31. - PubMed
    1. ICH Q5E guidelines. http://www.ich.org/LOB/media/MEDIA1196.pdf.

Publication types

MeSH terms