. 2010;12(20):5353-68.
doi: 10.1039/b925496j.

Prototropic equilibria in DNA containing one-electron oxidized GC: intra-duplex vs. duplex to solvent deprotonation

Affiliations

Prototropic equilibria in DNA containing one-electron oxidized GC: intra-duplex vs. duplex to solvent deprotonation

Amitava Adhikary et al. Phys Chem Chem Phys. 2010.

Abstract

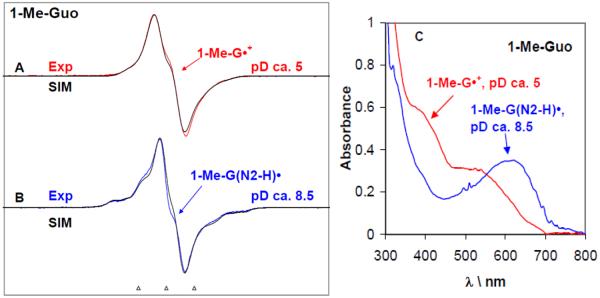
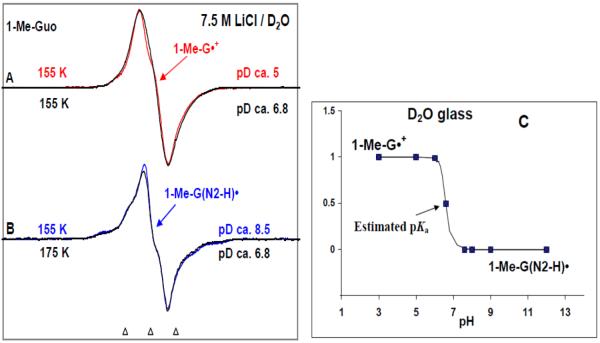
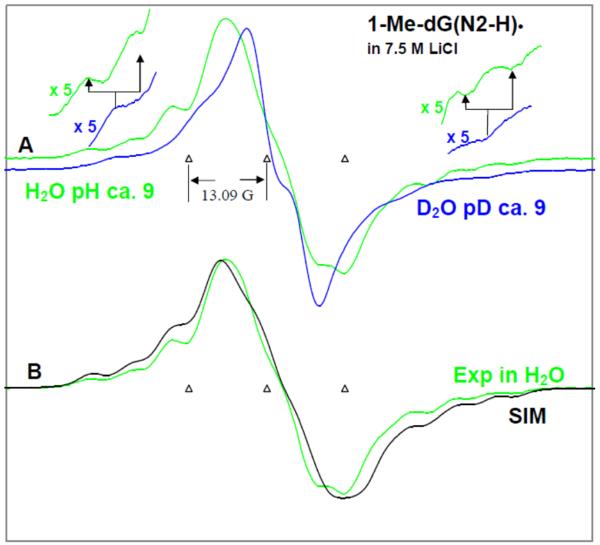
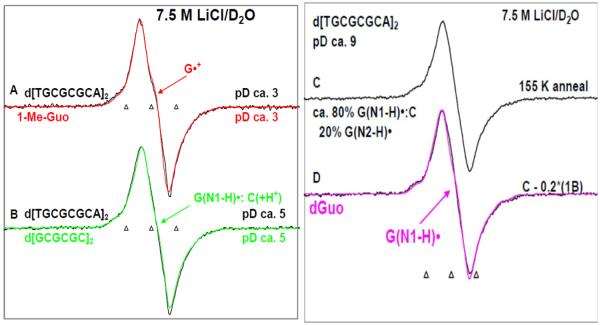
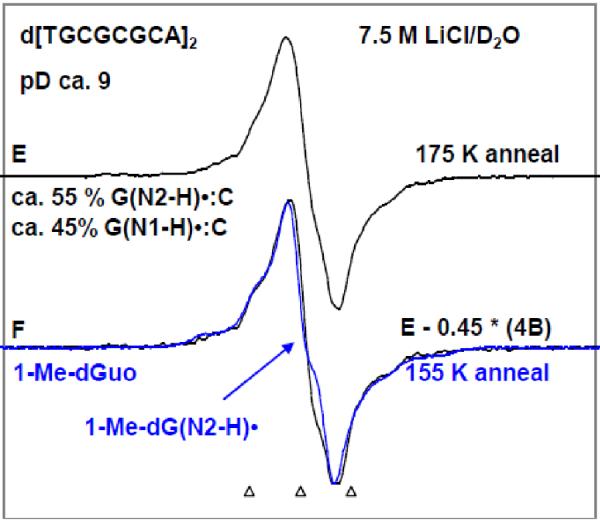
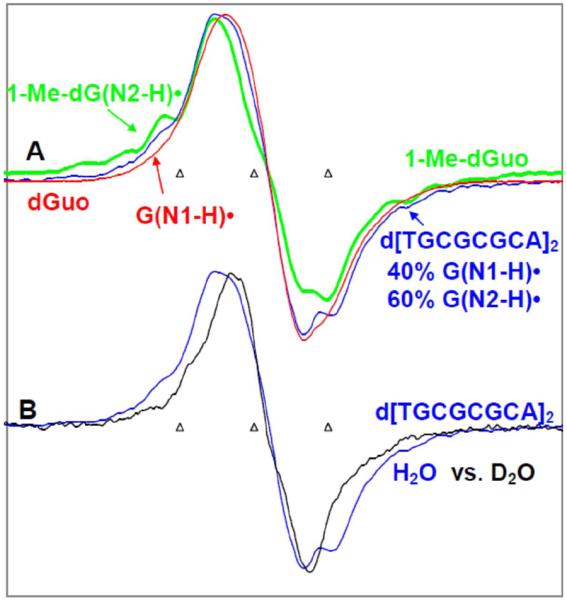
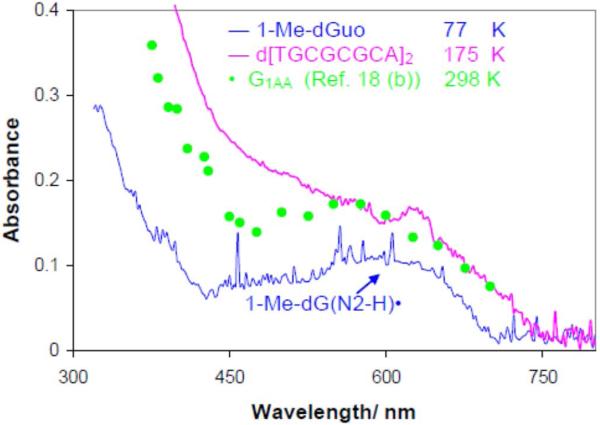
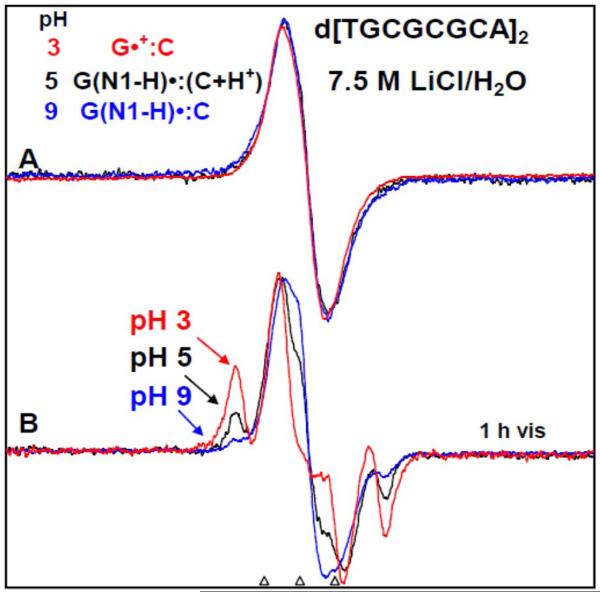
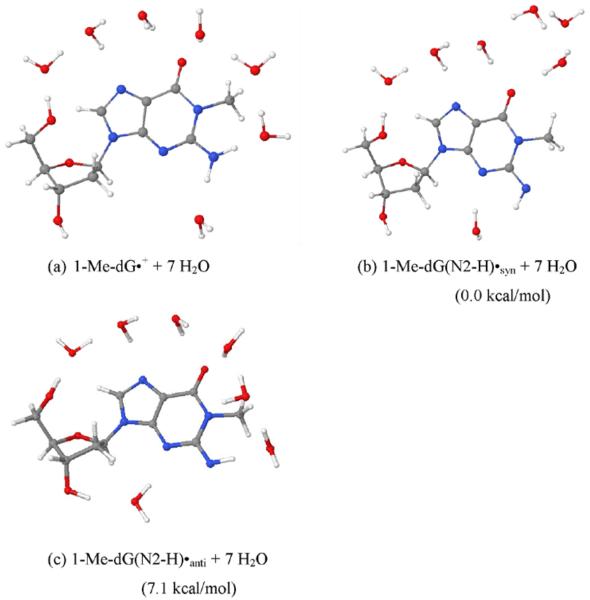
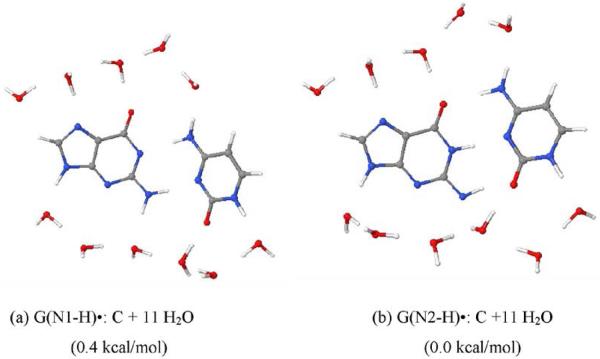
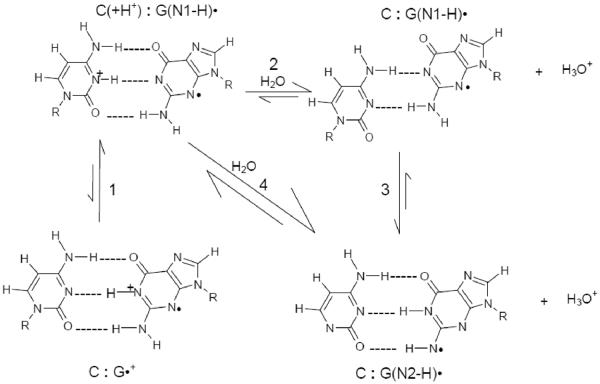
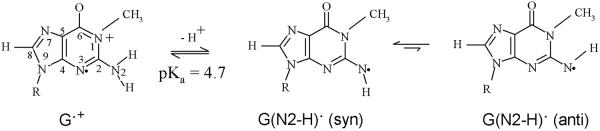
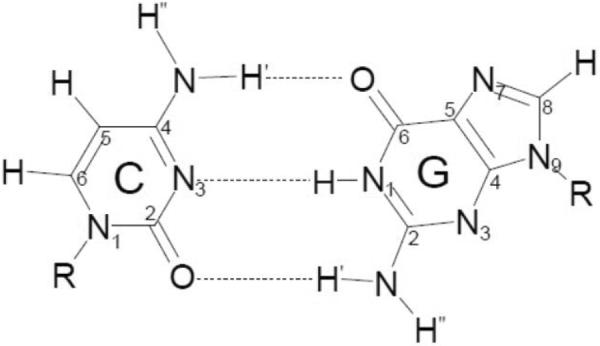
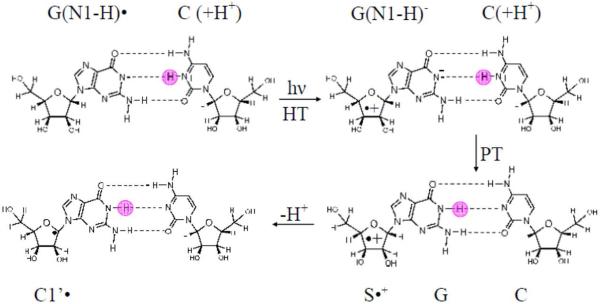
By use of ESR and UV-vis spectral studies, this work identifies the protonation states of one-electron oxidized G:C (viz. G˙+:C, G(N1–H)˙:C(+H+), G(N1–H)˙:C, and G(N2-H)˙:C) in a DNA oligomer d[TGCGCGCA]2. Benchmark ESR and UV-vis spectra from one electron oxidized 1-Me-dGuo are employed to analyze the spectral data obtained in one-electron oxidized d[TGCGCGCA]2 at various pHs. At pH ≥7, the initial site of deprotonation of one-electron oxidized d[TGCGCGCA]2 to the surrounding solvent is found to be at N1 forming G(N1–H)˙:C at 155 K. However, upon annealing to 175 K, the site of deprotonation to the solvent shifts to an equilibrium mixture of G(N1–H)˙:C and G(N2–H)˙:C. For the first time, the presence of G(N2–H)˙:C in a ds DNA-oligomer is shown to be easily distinguished from the other prototropic forms, owing to its readily observable nitrogen hyperfine coupling (Azz(N2) = 16 G). In addition, for the oligomer in H2O, an additional 8 G N2–H proton HFCC is found. This ESR identification is supported by a UV-vis absorption at 630 nm which is characteristic for G(N2–H)˙ in model compounds and oligomers. We find that the extent of photo-conversion to the C1′ sugar radical (C1′˙) in the one-electron oxidized d[TGCGCGCA]2 allows for a clear distinction among the various G:C protonation states which can not be easily distinguished by ESR or UV-vis spectroscopies with this order for the extent of photo-conversion: G˙+:C > G(N1–H)˙:C(+H+) ≫ G(N1–H)˙:C. We propose that it is the G˙+:C form that undergoes deprotonation at the sugar and this requires reprotonation of G within the lifetime of exited state


Figures

Figure 1
Figure 1
ESR spectra obtained at 77 K for the one-electron oxidized 1-Me-Guo by Cl2 (A, B) at various pDs in 7.5 M LiCl glasses in D2O in the presence of the electron scavenger K2S2O8. Figure (C) represents the UV-visible absorption spectra of the same samples of one-electron oxidized 1-Me-Guo – 1-Me-G•+ (red) and 1-Me-G(N2-H)• respectively at 77 K in 7.5 M LiCl glass/D2O. In Table 1, the ESR parameters, hyperfine couplings and g-values, used for the simulated spectra (black) are given. Our results clearly show that 1-Me-G•+ is found at pDs ≤5 and 1-Me-G(N2-H)• is formed at pDs 8–12. The ESR spectra as well as the UV-vis spectra were recorded at 77 K. The three reference markers showing the ESR spectra in this Figure and in subsequent Figures containing ESR spectra are Fremy's salt resonances with central marker is at g= 2.0056, and each of three markers is separated from one another by 13.09 G.
Figure 2
Figure 2
ESR spectra of: authentic (A) 1-Me-G•+ (red) and (B) 1-Me-G(N2-H)• (blue) obtained from glassy (7.5 M LiCl in D2O) samples of 1-Me-Guo via annealing at 155 K in the dark. The match of these experimentally observed spectra of 1-Me-G•+ and 1-Me-G(N2-H)• as benchmarks with those obtained using one-electron oxidized 1-Me-Guo (black) at pD ca. 6.8 first annealed at 155 K and further annealed at 175 K indicate that for one-electron oxidized 1-Me-Guo at pD 6.8, annealing at 155 K produces first the cation radical 1-Me-G•+ and further annealing at 175 K leads to its deprotonation to form G(N2–H)•. From these results, we estimate the pKa of 1-Me-G•+ as ca. 6.6 in our system (7.5 M LiCl in D2O at low temperature) as shown in Figure (C).
Figure 3
Figure 3
(A) ESR spectra of authentic 1-Me-dG(N2-H)• obtained from glassy (7.5 M LiCl) in D2O (blue) and in H2O (green) samples of 1-Me-dGuo by one-electron oxidation via annealing at 155 K in the dark. Expansion of the wings by factor of 5 shows the Azz component of N2-H coupling in H2O – which is lost in D2O. (B) Comparison of the spectrum of 1-Me-dG(N2-H)• obtained from glassy (7.5 M LiCl) in H2O (green) samples of 1-Me-dGuo with the simulated spectrum (black). In Table 1, the ESR parameters, hyperfine couplings and g-values, used for the simulated spectrum (black) are provided. Our results clearly show that in 1-Me-dG(N2-H)• in H2O, the additional line components due to the HFCC value of N2-H atom are clearly observable at the wings of the spectrum. All the ESR spectra were recorded at 77 K.
Figure 4
Figure 4
ESR spectra of one-electron oxidized guanine in d[TGCGCGCA]2 in 7.5 M LiCl/D2O (black) in the presence of K2S2O8 as an electron scavenger at various pDs (A) at pD ca. 3, (B) at pD ca. 5, (C, E) at pD ca. 9 obtained by annealing in the dark at 155 K for 15 – 20 min. Authentic G•+ spectrum (red) from 1-Me-Guo (Figure 1A) has been superimposed on spectrum (A). Authentic G(N1-H)•:C(+H+) spectrum (green) obtained from one-electron oxidized d[GCGCGC]2 from our previous work has been superimposed on spectrum (B). Spectrum (D) is obtained by subtraction (ca. 20%) of 1-Me-G(N2-H)• (Spectrum 1B). As shown this resultant spectrum matches that of spectrum G(N1-H)• from dGuo in pink from our previous work where the deprotonation occurs from N1 site in one-electron oxidized dGuo to the solvent. Spectrum (E) is obtained by further annealing the sample used to obtain spectrum (C) at 175 K in the dark for 15 min. Subtraction (ca. 45%) of spectrum 4B from spectrum 4E resulted in spectrum 4F. Authentic spectrum of G(N2-H)• obtained from 1-Me-Guo (Figure 1B) is superimposed on spectrum 4F. Spectrum (A) is assigned to G•+, spectrum (B) to G(N1-H)•:C(+H+), spectrum (D) is assigned to G(N1-H)•:C. and spectrum (F) to G(N2-H)•:C. All the spectra were recorded at 77 K.
Figure 4
Figure 4
ESR spectra of one-electron oxidized guanine in d[TGCGCGCA]2 in 7.5 M LiCl/D2O (black) in the presence of K2S2O8 as an electron scavenger at various pDs (A) at pD ca. 3, (B) at pD ca. 5, (C, E) at pD ca. 9 obtained by annealing in the dark at 155 K for 15 – 20 min. Authentic G•+ spectrum (red) from 1-Me-Guo (Figure 1A) has been superimposed on spectrum (A). Authentic G(N1-H)•:C(+H+) spectrum (green) obtained from one-electron oxidized d[GCGCGC]2 from our previous work has been superimposed on spectrum (B). Spectrum (D) is obtained by subtraction (ca. 20%) of 1-Me-G(N2-H)• (Spectrum 1B). As shown this resultant spectrum matches that of spectrum G(N1-H)• from dGuo in pink from our previous work where the deprotonation occurs from N1 site in one-electron oxidized dGuo to the solvent. Spectrum (E) is obtained by further annealing the sample used to obtain spectrum (C) at 175 K in the dark for 15 min. Subtraction (ca. 45%) of spectrum 4B from spectrum 4E resulted in spectrum 4F. Authentic spectrum of G(N2-H)• obtained from 1-Me-Guo (Figure 1B) is superimposed on spectrum 4F. Spectrum (A) is assigned to G•+, spectrum (B) to G(N1-H)•:C(+H+), spectrum (D) is assigned to G(N1-H)•:C. and spectrum (F) to G(N2-H)•:C. All the spectra were recorded at 77 K.
Figure 5
Figure 5
ESR spectra of one-electron oxidized d[TGCGCGCA]2 and model compounds in glassy 7.5 M LiCl solutions at pH ca. 9. (A) ESR spectrum of G(N2-H)• obtained from d[TGCGCGCA]2 in H2O (blue) formed after annealing to ca. 173 K. The authentic G(N2-H)• spectrum (green) from 1-Me-dGuo and the authentic G(N1-H)• spectrum (red) obtained from dGuo are superimposed on it. The wings show the Azz component of the exchangeable N2-H coupling in ds oligomer in H2O. (B) Comparison of the spectrum of one-electron oxidized d[TGCGCGCA] in H2O from A (blue) with that found in D2O (black) for an otherwise identical sample. The Azz component of the remaining N2-H proton hyperfine coupling of G(N2-H)• is clearly visible in the wings spectrum (blue) in Figure (B). All ESR spectra were recorded at 77 K.
Figure 6
Figure 6
The UV-visible absorption spectra of one-electron oxidized guanine in oligos and model compounds. The pink line is that of one-electron oxidized d[TGCGCGCA]2 in glassy (7.5 M LiCl) in H2O at pH 9 at 180K and is assigned to G(N2-H)•:C. The ESR spectrum is shown in Figure 5A. In blue the UV-vis spectrum of an authentic G(N2-H)• from 1-Me-Guo (blue) at 77 K in 7.5 M LiCl glass/H2O at pH 9 whose ESR spectrum is also shown in Figure 5A. The green data points are taken from existing pulse radiolysis spectrum of one-electron oxidized guanine containing oligo (sequence G1AA, see Figure 4 in Ref. 18b) in aqueous solution at ambient temperature. The spectra in the pink, green, and the blue spectrum have been multiplied by 2.5, 4, and 0.5 respectively. The spikes in the blue UV-vis spectra are due to bubbles from liquid nitrogen.
Figure 7
Figure 7
(A) ESR spectra of one-electron oxidized d[TGCGCGCA]2 in 7.5 M LiCl/H2O in the presence of K2S2O8 as an electron scavenger at three pHs - at pH ca. 3 (red), ca. 5 (black), and at ca. 9 (blue). After 1h of photo-excitation by a 250 W photoflood lamp at 148 K, sugar radical formation indicated by the arrows is shown in Figure (B). The outer components are due to the C1′-radical. The extent of sugar radical formation via photo-excitation of one-electron oxidized d[TGCGCGCA]2 at pH ca. 3 is found to be higher by a factor of 7.5, and at pH ca. 5 is found to be higher by a factor of 3 than the corresponding extent of sugar radical formation at pH ca. 9. On this basis, spectrum at pH ca. 3 (red) is assigned to the cation radical G•+ in the ds DNA-oligomer, spectrum at pH ca. 5 (black) in (A) to G(N1-H)•:C(+H+) whereas the spectrum at pH ca. 9 (red) in (A) is assigned to G(N1-H)•:C. All spectra were recorded at 77 K.
Figure 8
Figure 8
The fully optimized geometries of (a) 1-Me-dG•+, (b) 1-Me-dG(N2-H)•syn, and (c) 1-Me dG(N2-H)•anti in the presence of seven water molecules. The optimization was carried out with the aid of DFT/B3LYP/6-31G(d) method. The relative stabilities of 1-Me-dG(N2-H)•syn and 1-Me-dG(N2-H)•anti in kcal/mol are provided in parentheses.
Figure 9
Figure 9
The fully optimized geometries of (a) G(N1-H)•:C and (d) G(N2-H)•:C in the presence of 11 water molecules. The optimization was carried out with the aid of DFT/B3LYP/6-31+G** method. The relative stabilities between G•+: C and G(N1-H)•:C(+H+) and G(N1-H)•:C and G(N2-H)•:C are given in parentheses.
Scheme 1
Scheme 1
Schematic representation of prototropic equilibria in the one-electron oxidized G:C. The intra-base pair proton transfer within the one-electron oxidized G:C (process 1) and proton transfer to water either from the N1 atom (process 2) or from the nitrogen atom in the exocyclic amine (N2) of the guanine moiety in the one-electron oxidized G:C (process 4) are shown. The interconversion between G(N1-H)•:C and G(N2-H)•:C is represented by process 3. The conformation of the G(N1-H)•:C shown in this scheme has been adopted from the gas phase optimized geometry obtained by Bera et al. by using DFT (see ref. 25 for details) and this conformation of G(N1-H)•:C has been verified in this work for hydrated one-electron oxidized G:C.
Scheme 2
Scheme 2
Prototropic equilibria of one-electron oxidized guanine in 1-methyl guanine including the cation radical (G•+), the mono- deprotonated species, G(N2-H)•, in syn and anti- conformers with respect to the N3 atom). The numbering scheme shown here is followed in this work involving the theoretical calculations with 1-Me-dGuo.
Scheme 3
Scheme 3
The numbering scheme for the calculations of one-electron oxidized G:C structures shown in scheme 1.
Scheme 4
Scheme 4
Plausible mechanism for the sugar radical formation via excited G(N1-H)•:C(+H+).

Similar articles

Cited by

References

    1. von Sonntag C. Free-radical-induced DNA Damage and Its Repair. Springer-Verlag; Berlin, Heidelberg: 2006. pp. 335–447.
    1. Wagenknecht H-A, editor. Charge Transfer in DNA: From Mechanism to Application. Wiley-VCH Verlag GmbH & Co.; KGaA, Weiheim: 2005.
    1. Schuster GB, editor. Topics in Current Chemistry. Springer-Verlag; Berlin, Heidelberg: 2004. Long Range Charge Transfer in DNA. I and II.
    1. Wang Q, Fiebig T. In: Charge Migration in DNA Physics, Chemistry and Biology Perspectives. Chakraborty T, editor. Springer-Verlag; Berlin, Heidelberg: 2007. pp. 221–248.
    1. Giese B. Ann. Rev. Biochem. 2002;71:51–70. - PubMed

Publication types