. 2011 May 24;50(20):4360-70.
doi: 10.1021/bi200333k. Epub 2011 Apr 27.

Biochemical characterization of metnase's endonuclease activity and its role in NHEJ repair

Affiliations

Biochemical characterization of metnase's endonuclease activity and its role in NHEJ repair

Brian D Beck et al. Biochemistry. .

Abstract

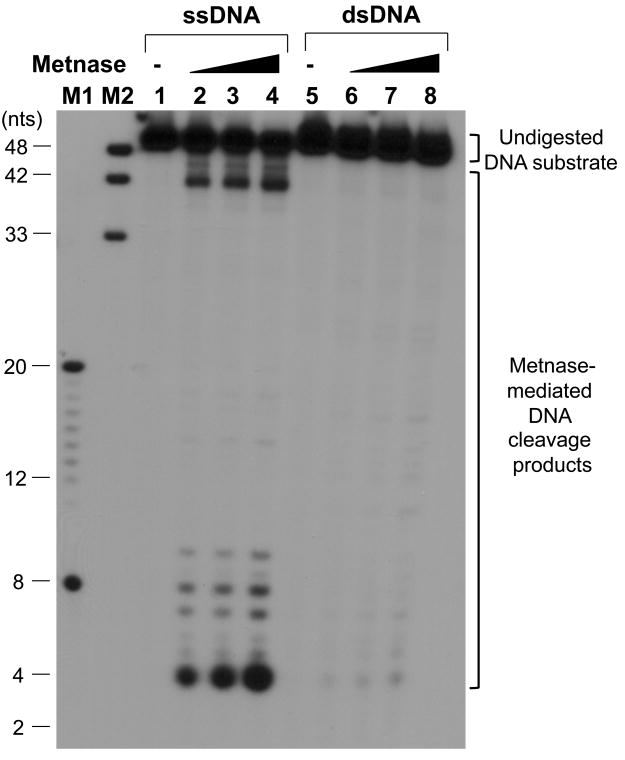
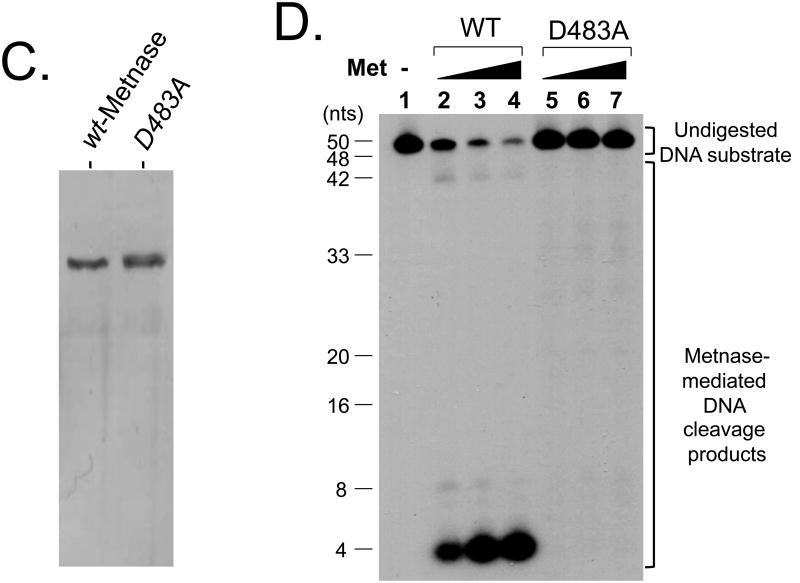
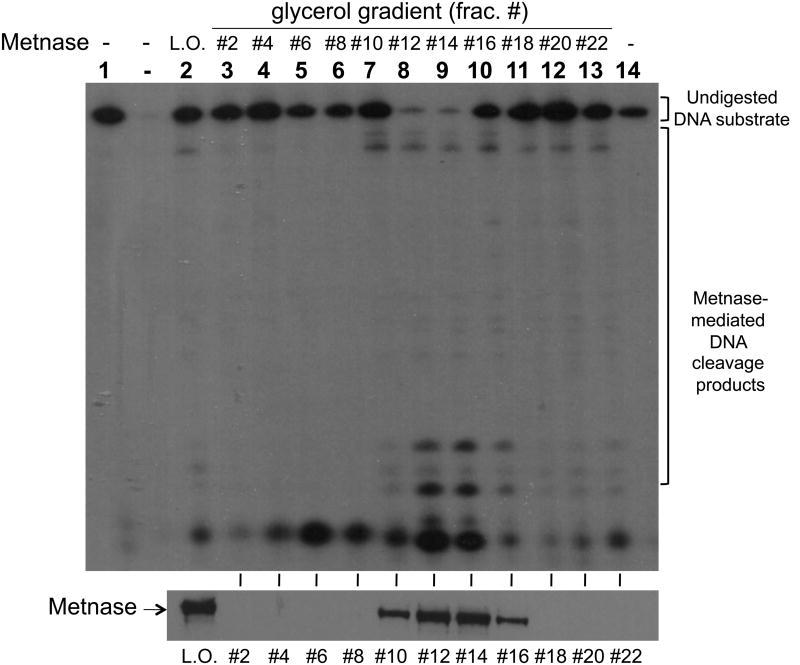
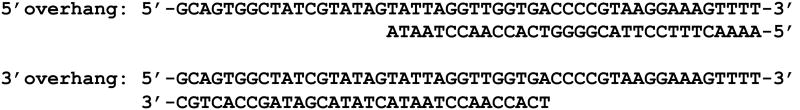
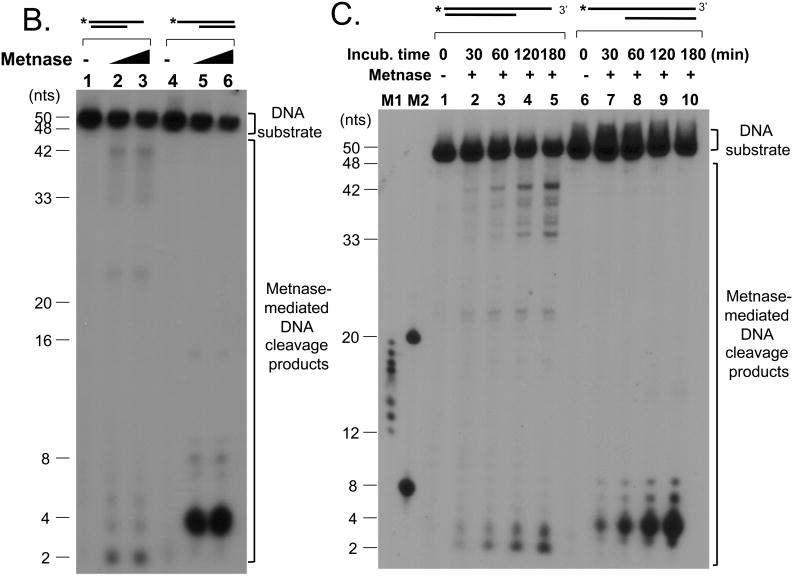
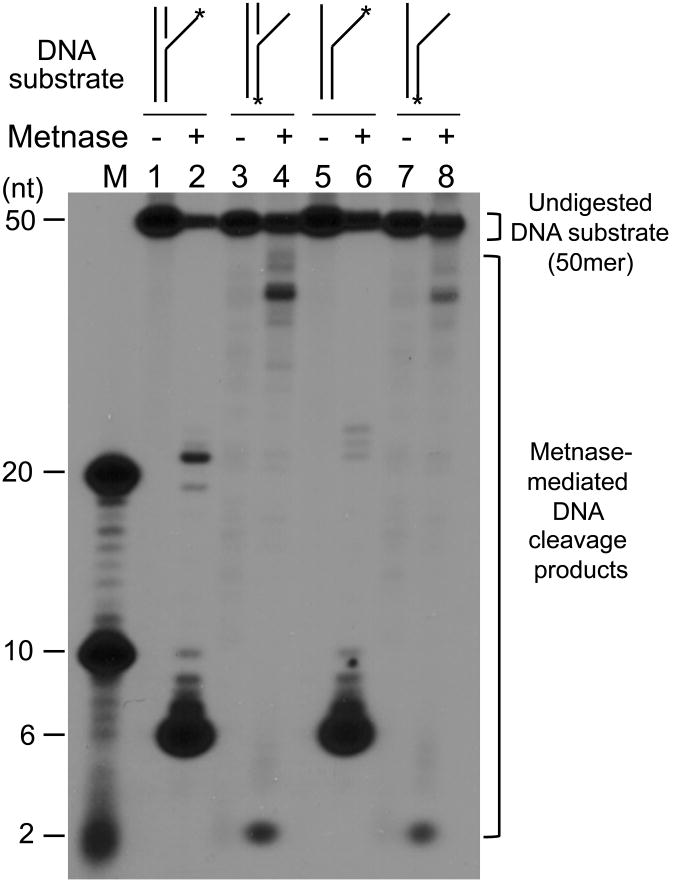
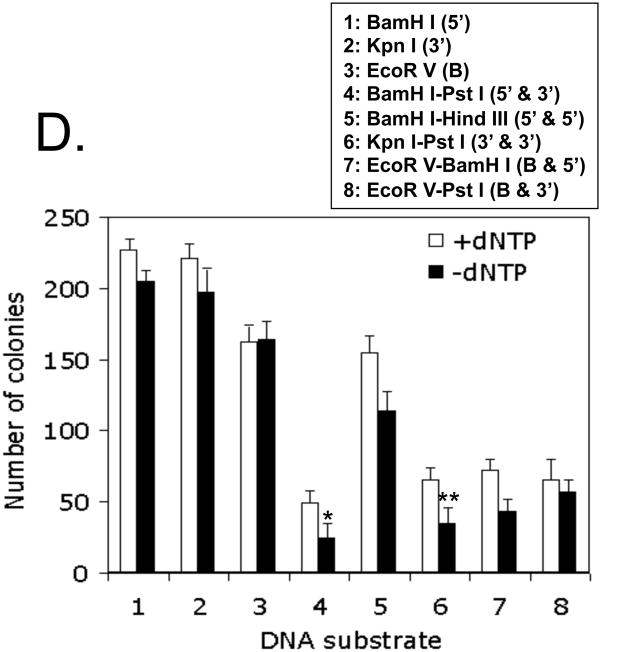
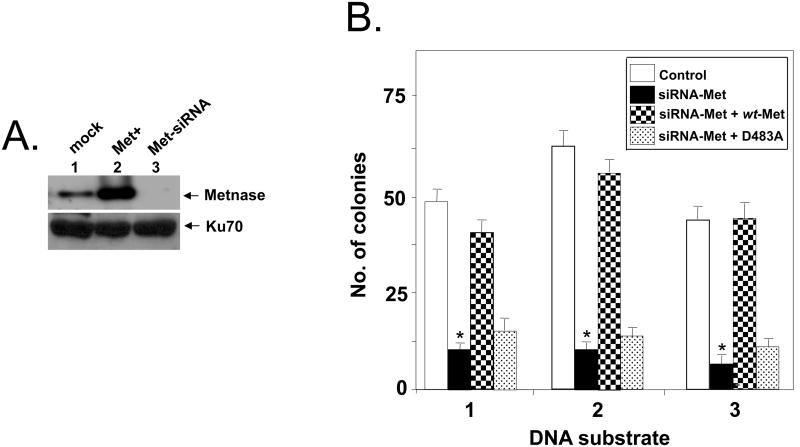
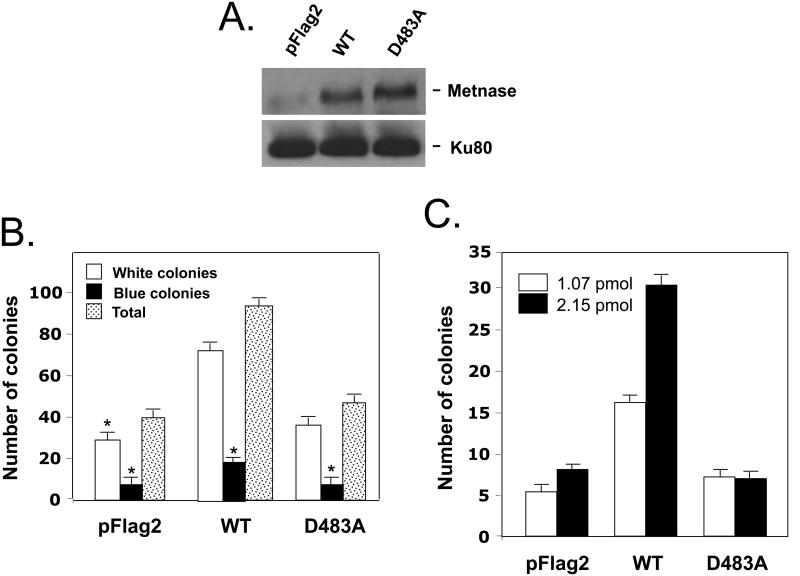
Metnase (SETMAR) is a SET-transposase fusion protein that promotes nonhomologous end joining (NHEJ) repair in humans. Although both SET and the transposase domains were necessary for its function in DSB repair, it is not clear what specific role Metnase plays in the NHEJ. In this study, we show that Metnase possesses a unique endonuclease activity that preferentially acts on ssDNA and ssDNA-overhang of a partial duplex DNA. Cell extracts lacking Metnase poorly supported DNA end joining, and addition of wt-Metnase to cell extracts lacking Metnase markedly stimulated DNA end joining, while a mutant (D483A) lacking endonuclease activity did not. Given that Metnase overexpression enhanced DNA end processing in vitro, our finding suggests a role for Metnase's endonuclease activity in promoting the joining of noncompatible ends.


Figures

Figure 1
Figure 1. Metnase prefers ssDNA over dsDNA for its DNA cleavage activity
(A) DNA substrates (50-mer of ss- and dsDNA) used in this study. (B) Reaction mixtures (20 μl) containing 50 fmol of 5′-32P-labeled ssDNA (lanes 1-4) or dsDNA (lanes 5-8) were incubated with 0 ng (lanes 1 & 5), 25 ng (lanes 2 & 6), 50 ng (lanes 3 & 7), and 100 ng (lanes 4 & 8) of wt-Metnase in the presence of 2 mM MgCl2. After incubation for 60 min at 37°C, cleavage products were analyzed by 12% PAGE containing 8M urea. DNA size makers were indicated on the left (lanes M1 & M2). (C) 10% SDS-PAGE (silver staining) of of purified wt-Metnase and D483A (50 ng each) used in this study. (D) The mutant (D483A) lacks ssDNA cleavage activity. Reaction mixtures (20 μl) containing 50 fmol of 5′-32P-labeled 50-mer ssDNA were incubated with 0 ng (lanes 1), 50 ng (lanes 2 & 5), 100 ng (lanes 3 & 6), and 200 ng (lanes 4 & 7) of either wt-Metnase (lanes 2-4) or D483A (lanes 5-7). After incubation at 37°C for 60 min, reaction mixtures were analyzed by 12% PAGE containing 8M urea for ssDNA cleavage. DNA size markers were indicated on the left. (E) Biochemical analysis of glycerol gradient fractions of wt-Metnase for ssDNA cleavage activity. Fractions collected from a glycerol gradient centrifugation (see Materials & Methods' for details) were analyzed by western blot of wt-Metnase (bottom panel) and ssDNA cleavage activity (top panel). Lane 1 contains only DNA substrate. L.O. represents load-on of glycerol gradient centrifugation (immunoaffinity purified wt-Metnase)
Figure 2
Figure 2. Metnase has a preferred DNA cleavage activity at single-strand region of a partial duplex DNA
(A) Partial duplex DNA with either 5′- or 3′-ssDNA overhang used in this study. (B) Reaction mixtures (20 μl) containing either 50 fmol of 5′-32P-labeled 3′-overhang DNA (lanes 1-3) or 5′-overhang DNA (lanes 4-6) were incubated with 0 ng (lanes 1, 4), 50 ng (lanes 2, 5), and 100 ng (lanes 3, 6) of wt-Metnase. After incubation for 90 min at 37°C, reaction mixtures were analyzed by 12% PAGE containing 8M urea. (C) Kinetic analysis of Metnase's DNA cleavage activity with 3′- (lanes 1-5) or 5′-overhang (lanes 6-10) partial duplex DNA in the presence of wt-Metnase (100 ng). M1 & M2 represent two DNA markers used in this study.
Figure 3
Figure 3. Characterization of Metnase's DNA cleavage activity with different DNA substrates
(A) Metnase preferentially cleaves ssDNA overhang of flap and pseudo Y DNA. Wt-Metnase (0 or 50 ng) was incubated with 100 fmol of 5′-P32-labeled DNA substrate indicated on the top (see Table 1 for the details of individual substrates) for 60 min prior to 12% denatured PAGE (+ 8M urea) analysis. Lanes “M” represent DNA markers. (B) Metnase exhibits both 3′- and 5′-ssDNA overhang cleavage activity. Metnase (0 or 50 ng) was incubated with 5′-flap DNA (lanes 1-2), 3′-flap DNA (lanes 3-4), 5′-pseudo Y DNA (lanes 5-6), and 3′-pseudo Y DNA (lanes 7-8). M represents DNA markers. (C) Diagrams of the major DNA cleavage sites catalyzed by Metnase. Arrows mark the major cleavage sites from the 32P-labeled (*) 5′-end (calculated from the cleavage products shown in Fig. 3). The length of the arrows approximately was proportional to the intensity of resulting cleavage products.
Figure 4
Figure 4. Intramolecular joining of linearized DNA in a cell-free system
(A) Intramolecular end joining assay that measures joining of linearized plasmid DNA in a cell-free system. Following incubation of linearized pBS with cell extracts at 37°C, DNA is isolated and transformed into E. coli for colony counts. (B) The assay was carried out in the presence or absence of 1 mM ATP, 1 mM MgCl2, or 10 uM wortmannin for 60 min prior to DNA isolation and E. coli transformation for colony counts. Where indicated, cell extracts were pre-incubated for 30 min on ice with wortmannin. Wortmannin was dissolved in DMSO at a high concentration (10 mM) to limit the final DMSO concentration in the reaction mixtures to less than 1%. Values are average (±SEM) of 6 independent assays. *P < 0.005; **P = 0.01. (C) Intramolecular end joining is dependent on Ku80 and DNA-PKcs. Normal mouse fibroblast (black bar) or cells lacking Ku80 (checker bar), DNA-PKcs (white bar), or ATM (grey bar) (47) were used to prepare cell extracts. DNA end joining assay coupled to E. coli colony formation was carried out with linearized pBS with containing 5′-overhangs, 3′-overhangs, or blunt ends. Values are averages (±SEM) of 3 distinct determinations. P < 0.01; *P = 0.05. (D) Intramolecular end joining of linearized DNA in the presence and absence of dNTPs. Linearized pBS DNA (1.0 μg) with different compatible or non-compatible ends was incubated with 30 μg of HEK-293 cell extracts, 1 mM MgCl2, and 1 mM ATP for 60 min. Where indicated, 25 μM dNTPs were included. Following incubation, DNA was isolated and transformed into E. coli for colony counts. Numbers 1-8 represent DNA substrates used for DNA end joining assay. B, 5′, and 3′ represent DNA ends with blunt ends, 5′-overhang, and 3′-overhangs, respectively. Values are the average (±SEM) of 3 separate experiments. P < 0.01; *P = 0.05; **P = 0.07.
Figure 5
Figure 5. Wt-Metnase stimulated intramolecular joining of linearized DNA in a cell-free system, while a mutant (D483A) lacking DNA cleavage activity did not
(A) A targeted inhibition of Metnase expression by a Metnase-specific siRNA (Met-siRNA). HEK-293 cells harboring Flag vector (control; lane 1), HEK293 cells stably expressing Flag-Metnase (Met+; lane 2), or HEK293 cells treated with Metnase-siRNA (Met-siRNA; lane 3) were incubated for 48 hrs prior to western blot analysis using an anti-Metnase polyclonal antibody. Expression of Ku70 was included as a loading control. (B) Addition of purified wt-Metnase but not the mutant (D483A) to cell extracts lacking Metnase restores DNA end joining activity. Reaction mixtures (100 μl) containing 30 μg of cell extracts, linearized pBS DNA (1.0 ug), 1 mM MgCl2 and 1 mM ATP were incubated for 60 min. Where indicated, 0.4 ug of purified wt-Metnase or the mutant protein (D483A) was added to the extracts lacking Metnase (siRNA-Met) prior to DNA end joining reactions. Following incubation, DNA was isolated and transformed into E. coli for colony counts. Numbers 1, 2, & 3 at the bottom of the figure represent pBS DNA digested with Bam HI-Hind III (5′-5′), Kpn I-Pst I (3′-3′), and Bam HI-Pst I (5′-3′), respectively, which produced linearized DNA with different non-compatible ends. The figure is representative of three DNA end joining assay. Values are the average (±SEM) of 3 separate experiments (P < 0.01, *P = 0.05).
Figure 6
Figure 6. A Metnase mutant (D483A) defective in DNA cleavage activity fails to stimulate DNA end joining in vivo
(A) Western blot analysis of HEK-293 cells stably transfected with pFlag vector (pFlag2), over-expressing wt-Metnase (WT), or over-expressing the mutant (D483A) using an anti-Metnase polyclonal antibody (top panel). Expression of Ku80 was included as a loading control (bottom panel). (B) Effect of wt-Metnase and D483A on intramolecular end joining of linearized (Eco RI-digested) pBS. Stable expression of either wt-Metnase or D483A in HEK-293 cells was examined for their imprecise repair (white colonies), precise repair (blue colonies), and total NHEJ repair (blue + white colonies) as described previously (39). Values are averages (±SEM) of 3 distinct determinations. P < 0.01; *P = 0.05. (C) The mutant (D483A) lacking DNA cleavage activity failed to promote integration of foreign DNA into chromosomes. HEK-293 cells stably transfected with pFlag2, pFLAG2-wt-Metnase (WT), or pFLAG2-D483A (D483A) were transfected with 2 ug (1.07 pmol) & 4 ug (2.15 pmol) of pRNA/U6-Hygro, and the number of hygromycin-resistant colonies was a measure of genomic integration as described previously (32). Values are the average (±SEM) of 5 separate experiments (P < 0.01).

Similar articles

Cited by

References

    1. Bennett CB, Lewis AL, Baldwin KK, Resnick MA. Lethality induced by a single site-specific double-strand break in a dispensable yeast plasmid. Proc Natl Acad Sci U S A. 1993;90:5613–5617. - PMC - PubMed
    1. Bennett CB, Westmoreland TJ, Snipe JR, Resnick MA. A double-strand break within a yeast artificial chromosome (YAC) containing human DNA can result in YAC loss, deletion or cell lethality. Mol Cell Biol. 1996;16:4414–4425. - PMC - PubMed
    1. Burma S, Chen BP, Chen DJ. Role of non-homologous end joining (NHEJ) in maintaining genomic integrity. DNA Repair (Amst) 2006;5:1042–1048. - PubMed
    1. Cahill D, Connor B, Carney JP. Mechanisms of eukaryotic DNA double strand break repair. Front Biosci. 2006;11:1958–1976. - PubMed
    1. Dudasova Z, Dudas A, Chovanec M. Non-homologous end-joining factors of Saccharomyces cerevisiae. FEMS Microbiol Rev. 2004;28:581–601. - PubMed

Publication types

LinkOut - more resources