. 2011 Sep;13(8):962-75.
doi: 10.3109/14653249.2011.571246. Epub 2011 Apr 15.

Labeling of mesenchymal stromal cells with iron oxide-poly(L-lactide) nanoparticles for magnetic resonance imaging: uptake, persistence, effects on cellular function and magnetic resonance imaging properties

Affiliations

Labeling of mesenchymal stromal cells with iron oxide-poly(L-lactide) nanoparticles for magnetic resonance imaging: uptake, persistence, effects on cellular function and magnetic resonance imaging properties

Gerlinde Schmidtke-Schrezenmeier et al. Cytotherapy. 2011 Sep.

Abstract

Background aims: Mesenchymal stromal cells (MSC) are the focus of research in regenerative medicine aiming at the regulatory approval of these cells for specific indications. To cope with the regulatory requirements for somatic cell therapy, novel approaches that do not interfere with the natural behavior of the cells are necessary. In this context in vivo magnetic resonance imaging (MRI) of labeled MSC could be an appropriate tool. Cell labeling for MRI with a variety of different iron oxide preparations is frequently published. However, most publications lack a comprehensive assessment of the non-interference of the contrast agent with the functionality of the labeled MSC, which is a prerequisite for the validity of cell-tracking via MRI.

Methods: We studied the effects of iron oxide-poly(l-lactide) nanoparticles in MSC with flow cytometry, transmission electron microscopy (TEM), confocal laser scanning microscopy (CLSM), Prussian blue staining, CyQuant® proliferation testing, colony-forming unit-fibroblast (CFU-F) assays, flow chamber adhesion testing, immunologic tests and differentiation tests. Furthermore iron-labeled MSC were studied by MRI in agarose phantoms and Wistar rats.

Results: It could be demonstrated that MSC show rapid uptake of nanoparticles and long-lasting intracellular persistence in the endosomal compartment. Labeling of the MSC with these particles has no influence on viability, differentiation, clonogenicity, proliferation, adhesion, phenotype and immunosuppressive properties. They show excellent MRI properties in agarose phantoms and after subcutaneous implantation in rats over several weeks.

Conclusions: These particles qualify for studying MSC homing and trafficking via MRI.


Figures
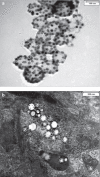
Figure 1
Figure 1
(a) TEM image of particle MU-Wuest 1 (the bar represents 100 nm); (b) representative example of a TEM image of MSC (passage 11) after 24 h incubation with MU-Wuest 1, showing endosomal particle agglomerates. The bar represents 300 nm.
Figure 2
Figure 2
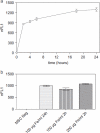
(a) FACS measurements showing the normalized relative fluorescence intensity (nFL1) of MSC (passage 5) incubated for 2, 4, 6, 18 and 24 h, respectively, with MU-Wuest 3 at a dose of 100 μg Fe/mL incubation medium. Results represent median ± standard deviation of triplicates, (b) FACS measurements showing the nFL1 intensity of MSC (passage 6) incubated for 24 h with MU-Wuest 3 100 μg Fe/mL or incubated for 2 h with 150 μg and 200 μg MU-Wuest 3, respectively. Results represent mean ± standard deviation of triplicates.
Figure 3
Figure 3
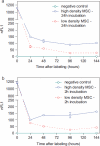
FACS measurements showing the nFL1 intensity of MSC (passage 5) incubated for 24 h with 100 μg Fe/mL (a) or incubated for 2 h with 200 μg Fe/mL MU-Wuest 3 (b) and then trypsinated and reseeded at high (20 000 cells/cm2) and low (5000 cells/cm2) densities. FACS measurements were done directly after incubation (0 h) and 24, 48, 96 and 144 h after particle removal and reseeding. Results represent mean ± standard deviation of triplicates. Most of the standard deviations are too small to be seen in this graph.
Figure 4
Figure 4
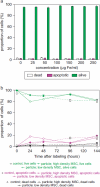
Relative proportion of living, apoptotic and dead cells as assessed by FACS measurements of 7-AAD-stained (a) MSC (passage 8), which were incubated for 24 h with MU-Wuest 3 in doses from 25 μg Fe/mL up to 250 μg Fe/mL, and (b) MSC incubated for 24 h with MU-Wuest 3 (100 μg Fe/mL) and then reseeded (5 × 10³ and 2 × 10⁴ cells/cm2) and followed-up 144 h after reseeding. Results represent mean ± standard deviation of triplicates. Dotted lines represent unlabeled control cells.
Figure 5
Figure 5
Expression of CD45, CD3, CD19, CD14, CD16, CD19, CD11b, CD9, CD13, CD73, CD90, CD105, CD166, HLA-A, -B, -C and HLA-DR on unlabeled control MSC and MSC 48 h after labeling with MU-Wuest 3 (passage 4 MSC). Thin lines show isotype controls and bold lines the expression of the respective surface antigen.
Figure 6
Figure 6
MSC adhesion under shear stress showing the number of adherent cells on a HUVEC cell layer pre-stimulated with TNF-α. MSC were labeled with MU-Wuest 3 at 100 μg Fe/mL for 24 h and thereafter tested. MSC were adhered to HUVEC under flow at 0.1 dynes/cm2. The resistance of the adhered cells to increased shear stress was determined after raising the shear stress to 2.0 dynes/cm2. Results indicate mean ± standard deviation of a total of six experiments using three different MSC lines (passages 4, 6 and 10).
Figure 7
Figure 7
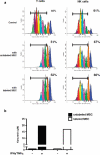
(a) Proliferation of purified T and NK cells in response to CD3/CD28 cross-linking or IL-2, respectively. CFSE dilution was evaluated on day 5 of culture without MSC (upper panels) or in the presence of unlabeled (middle panels) or labeled (lower panels) MSC. MSC (passage 1) were labeled with MU-Wuest 4 100 μg Fe/mL for 24 h. Results are expressed as the percentage of T or NK cells that had undergone more than one cell division; one representative experiment of two. (b) MSC previously labeled or not with nanoparticles were treated with IFN-γ/TNF-α for 2 days and IDO activity was assessed by quantification of kynurenin in cell supernatants; one representative experiment of two.
Figure 8
Figure 8
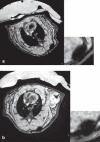
1 × 10⁶ MSC (passage 4) labeled with MU-Wuest 4 100 μg Fe/mL in 1 mL of a collagen scaffold 2 × 3 × 2-mm subcutaneous implant, (a) MRI taken 2 days after implantation; (b) MRI 25 days after implantation. As a control, the same number of unlabeled MSC in a scaffold was implanted on the contralateral side. No T2/T2* signal could be detected at the implantation site of the control.

Similar articles

Cited by

References

    1. Pittenger MF, Mackay AM, Beck SC, Jaiswal RK, Douglas R, et al. Multilineage potential of adult human mesenchymal stem cells. Science. 1999;284:143–7. - PubMed
    1. Sensebe L, Krampera M, Schrezenmeier H, Bourin P, Giordano R. Mesenchymal stem cells for clinical application. Vox Sang. 2009;98:93–107. - PubMed
    1. Abdallah BM, Kassem M. The use of mesenchymal (skel etal) stem cells for treatment of degenerative diseases: current status and future perspectives. J Cell Physiol. 2009;218:9–12. - PubMed
    1. Aggarwal S, Pittenger MF. Human mesenchymal stem cells modulate allogeneic immune cell responses. Blood. 2005;105:1815–22. - PubMed
    1. Granero-Molto F, Weis JA, Miga MI, Landis B, Myers TJ, et al. Regenerative effects of transplanted mesenchymal stem cells in fracture healing. Stem Cells. 2009;27:1887–98. - PMC - PubMed

Publication types

MeSH terms