. 2011 Jun;80(5):1349-65.
doi: 10.1111/j.1365-2958.2011.07650.x. Epub 2011 Apr 15.

Transcriptional regulators of the GAD acid stress island are carried by effector protein-encoding prophages and indirectly control type III secretion in enterohemorrhagic Escherichia coli O157:H7

Affiliations

Transcriptional regulators of the GAD acid stress island are carried by effector protein-encoding prophages and indirectly control type III secretion in enterohemorrhagic Escherichia coli O157:H7

Jai J Tree et al. Mol Microbiol. 2011 Jun.

Abstract

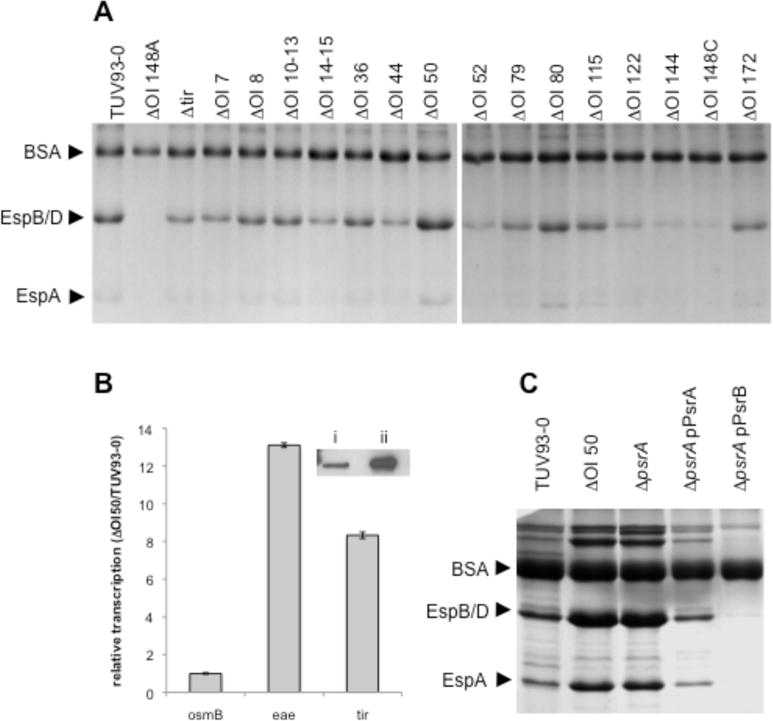
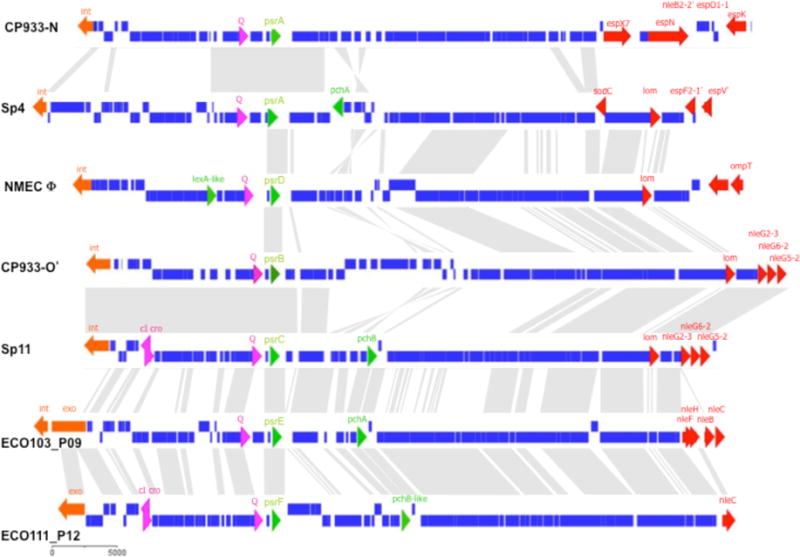
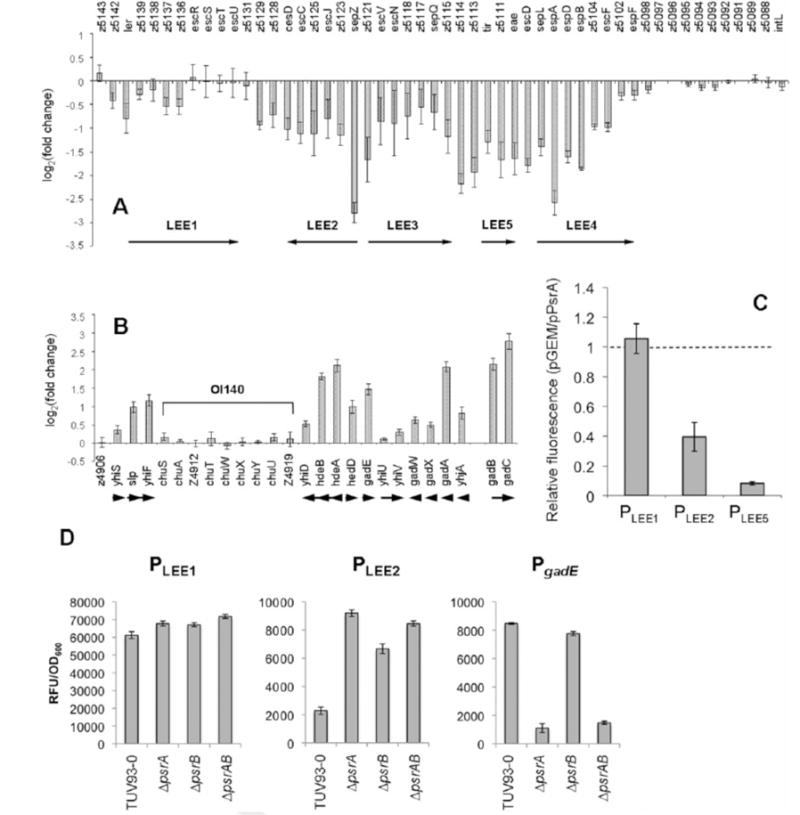
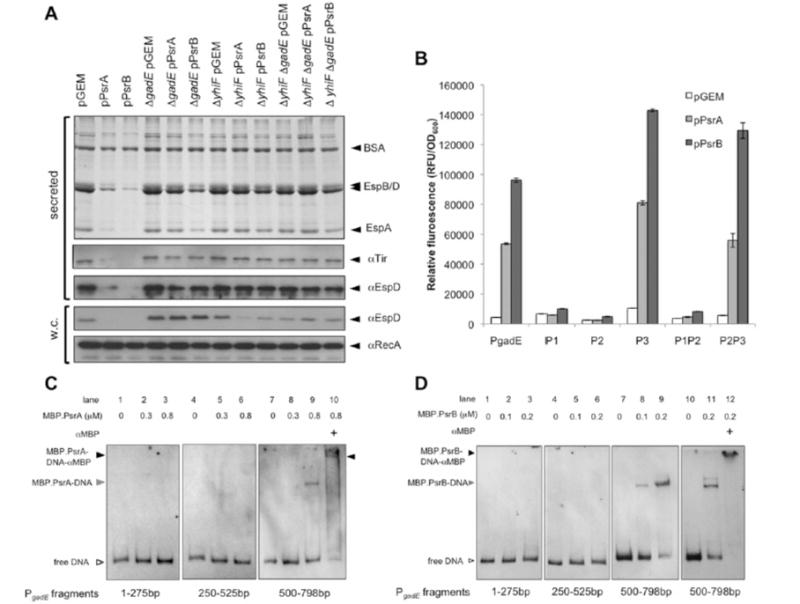
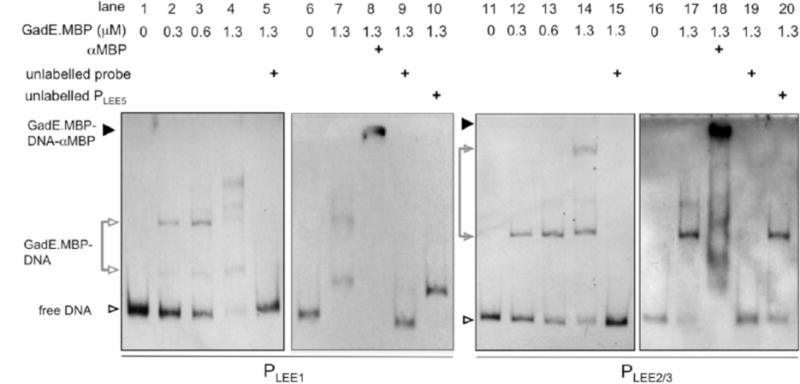
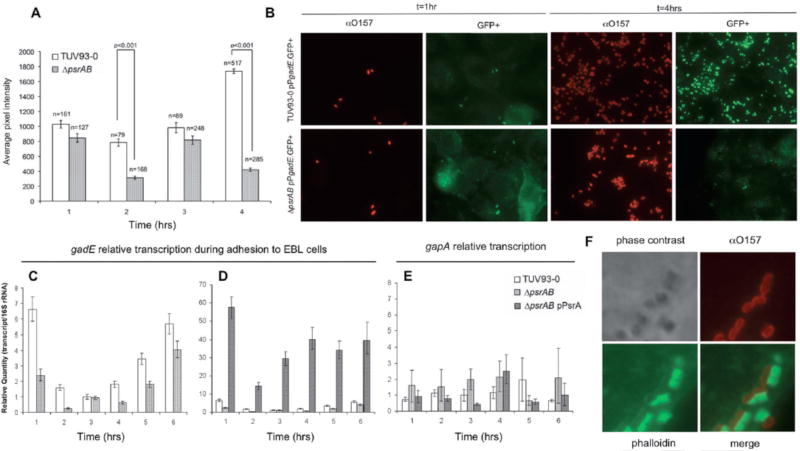
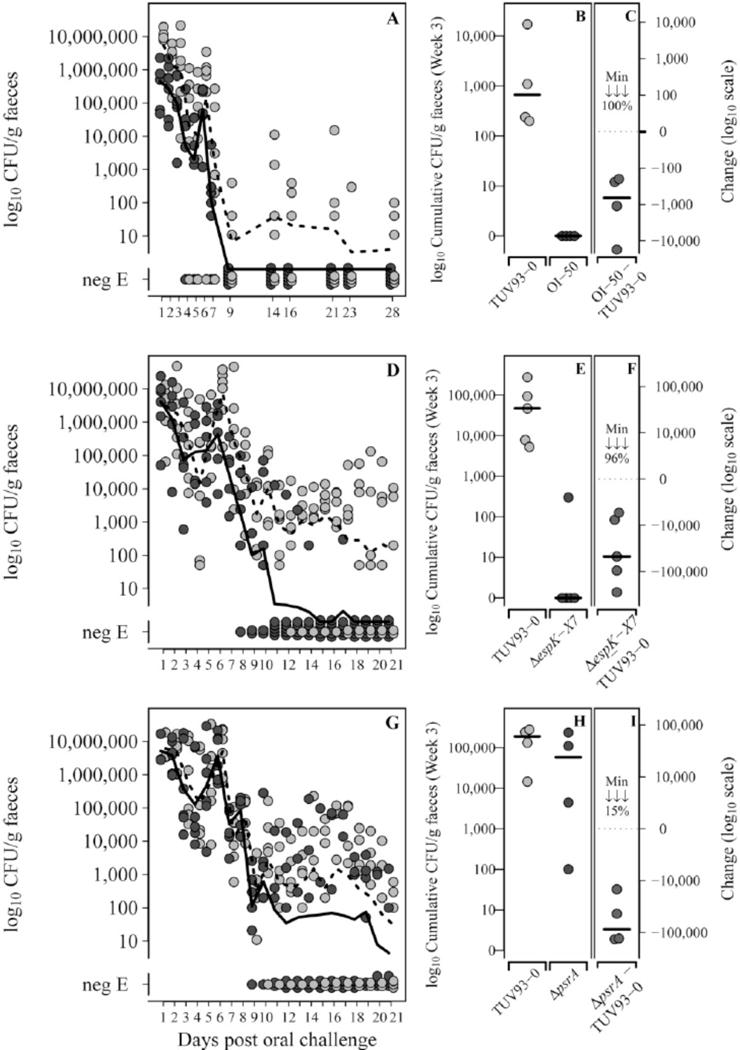
Type III secretion (T3S) plays a pivotal role in the colonization of ruminant hosts by Enterohemorrhagic Escherichia coli (EHEC). The T3S system translocates effector proteins into host cells to promote bacterial attachment and persistence. The repertoire and variation in prophage regions underpins differences in the pathogenesis and epidemiology of EHEC strains. In this study, we have used a collection of deletions in cryptic prophages and EHEC O157 O-islands to screen for novel regulators of T3S. Using this approach we have identified a family of homologous AraC-like regulators that indirectly repress T3S. These prophage-encoded secretion regulator genes (psr) are found exclusively on prophages and are associated with effector loci and the T3S activating Pch family of regulators. Transcriptional profiling, mutagenesis and DNA binding studies were used to show that these regulators usurp the conserved GAD acid stress resistance system to regulate T3S by increasing the expression of GadE (YhiE) and YhiF and that this regulation follows attachment to bovine epithelial cells. We further demonstrate that PsrA and effectors encoded within cryptic prophage CP933-N are required for persistence in a ruminant model of colonization.


Figures

Figure 1
Figure 1
OI-50 encodes a negative regulator of T3S. A: Coomassie stained secreted protein profiles for a collection of O-island deletion strains constructed in the stx- EHEC O157:H7, TUV93-0 (Campellone et al., 2004). ΔOI-148A and ΔOI-148C contain deletions within the LEE and are included as negative secretion controls. Arrows indicate bands corresponding to BSA (added as a precipitation carrier and loading control, 66.4 kDa), EspB/D needle tip proteins (32.6 kDa and 39.1 kDa respectively), and the filament EspA (20.6 kDa). B: RT-qPCR confirmation of an increase in LEE encoded transcripts eae and tir for ΔOI-50 relative to the parental TUV93-0 strain. osmB is included as a negative control. Inset: Western blot analysis of secreted Tir from i) TUV93-0 and ii) ΔOI-50. C. Secreted protein profiles for TUV93-0 and isogenic deletions in OI-50, z1789 (psrA), and z2104 (psrB) complemented with plasmid encoded psrA or psrB (z2104). Arrows indicate bands corresponding to BSA, EspB/D and EspA. D: Graphical representation of OI-50 (CP933-N) (xbase.bham.ac.uk/colibase/). Recognisable modules of the lambdoid phage are indicated below CP933-N. IX, integration/excision; GR, general recombination; rep, repressor/co- repressor; lysis, lysis encoding genes; tail, tail fibres; effector region, contains T3S effector proteins. Red boxes indicate deleted regions in relevant mutants.
Figure 2
Figure 2
Homologues of PsrA are encoded on cryptic prophage and associated with T3S regulators and effectors. Psr homologues were identified within publicly available genome sequences. All identified Psr homologues were identified within integrated prophage and the extremities were delineated by alignment with related prophage or annotated extremities. Prophages presented are representative of combinations of virulence genes found on Psr encoding prophage (an entire list of homologous sequences and encoding prophage are presented in Supp. Table 1). Prophage are indicated in bold (left) and are: CP933-N from EDL933, Sp4 from EHEC O157 Sakai, prophage sequence identified within NMEC O45:K1:H7 strain S88 (see Supp. Table 1), region of CP933-O from EDL933 homologous to Sp11, Sp11 from EHEC O157 Sakai, ECO103_P09 from EHEC O103:H2, ECO111_P12 from EHEC O111:H-. Grey areas between prophage represent related sequences. Genes are coloured: blue, prophage sequence; orange, int (integrase)/ xis (excisionase); pink, prophage regulators; green, T3S regulators; red, putative virulence genes encoded within tail fibres.
Figure 3
Figure 3
PsrA and PsrB induce the GAD acid stress regulators, gadE/yhiF, and repress the LEE. The PsrA regulon was defined by microarray analysis of TUV93-0 with psrA in trans on a multicopy plasmid. A: Relative transcription of the LEE in TUV93-0 pPsrA (pPsrA/pGEM) and B: Relative transcription of the GAD acid stress island. gadB and gadC are not encoded on the GAD island but have been included as part of the GAD regulon. In EDL933, OI-140 has been inserted into the GAD island and is indicated. Arrows below figure indicate direction of transcription. TUV93-0 pPsrB provided a similar transcriptional profile of the LEE and GAD island and is presented in Supplementary Table 2S. C: eGFP fusions of PLEE1 (pAJR71), PLEE2 (pAJR72), and PLEE5 (pAJR75) were used to confirm repression of the LEE in TUV93-0 pPsrA. Fluorescence of the pPsrA strains are presented as a fraction of the same fusion in a pGEM only background. The dashed line represents equal fluorescence between pGEM and pPsrA containing strains. D: Repression of LEE1 and LEE2 were confirmed in psrA, psrB, and psrAB deletion strains using eGFP fusions described above. Induction of gadE was similarly confirmed using a PgadE fusion to GFP+ (pPgadE.GFP+). Error bars represent standard error.
Figure 4
Figure 4
PsrA and PsrB repress the LEE by stimulating transcription of the negative LEE regulators GadE and YhiF. A: (top) Coomassie stained T3S secretion profiles of TUV93-0 and designated gadE and yhiF mutants with psrA or psrB in trans. (below) Western blots of secreted proteins (supernatant) and whole cell fractions (w.c.). Proteins recognized by the primary antibodies are indicated to the right of the blots B: Induction of gadE promoter fusions by pPsrA and pPsrB. TUV93-0 ΔgadE pPsrA, ΔgadE pPsrB, or ΔgadE pGEM were transformed with full length gadE promoter (PgadE), single promoter (P1, P2, and P3), or double gadE promoter (P1P2 and P2P3) fusions to GFP+ (Supplementary Table 1S). Fluorescence was normalized to OD600. Error bars represent standard error. C&D: EMSA was used to assess PsrA (C) and PsrB (D) binding to gadE promoter fragments containing transcriptional start sites. Start and stop positions for each DNA fragment from the gadE start codon are indicated below. Reaction constituents are indicated above. Open arrowhead indicates free labelled DNA, the grey arrowhead indicates MBP.Psr-DNA complexes, and the black arrowhead indicates supershifted MBP.Psr-DNA-antibody complexes.
Figure 5
Figure 5
GadE binds the LEE at both PLEE1 and PLEE2/3. Top: Electrophoretic mobility shift assays were used to demonstrate binding of MBP.GadE to the LEE1 and LEE2/3 promoters. Increasing concentrations of MBP.GadE (indicated top) were incubated with 60 fmoles of digoxin end labelled PLEE1 (lanes 1–4) or PLEE2/3 (lanes 9–12). Labelled DNA was competed from the complex using a 1000 fold excess of unlabelled PLEE1 (lane 5) or PLEE2/3 (lane 13). Sequence specific interactions between MBP.GadE and LEE promoter fragments were confirmed by incubating with 50 ng of unlabelled PLEE5 (lanes 10 & 20). The presence of MBP.GadE in the shifted DNA-protein complex was confirmed by supershifting the complex with polyclonal MBP antisera (lanes 8 & 16). Labelled DNA complexes are indicated by arrowheads: free DNA (open), DNA-MBP.GadE (grey), and DNA-MBP.GadE-antibody (black).
Figure 6
Figure 6
Transcription of gadE is induced by PsrA and PsrB after attachment to bovine epithelial (EBL) cells. A: TUV93-0 (open bars) and ΔpsrA ΔpsrB (shaded) bacteria containing a transcriptional fusion of the gadE promoter to GFP+ were used to infect EBL cell monolayers. Cells were fixed at indicated times and stained for immunofluorescence microscopy with O157 antibody. GFP+ expression in individual bacteria was measured as average pixel intensity across the area of the bacteria and averages of these intensities for indicated numbers of bacterial cells (n) are shown. A t-test was used to determine significance. Error bars represent standard error. B: Representative images from (A) of GFP+ expressing cells (green) stained with anti-O157 (red), obtained at 1 and 4 hours post-inoculation. C–F: RT-qPCR measurement of relative gadE transcription levels during adhesion to EBL cell monolayers. For clarity, TUV93-0 (open bars) and ΔpsrA ΔpsrB (light grey bars) are presented in (C) and the complemented ΔpsrA ΔpsrB pPsrA strain (dark grey bars) included in (D). E: gapA transcript abundance was also measured during adhesion in the TUV93-0, ΔpsrA ΔpsrB, and ΔpsrA ΔpsrB pPsrA backgrounds. F: Bacteria were visualized 3hr after addition to EBL monolayers. Bacterial cells were stained with anti-O157 antisera (red) and actin-rich pedestals stained with FITC conjugated phalloidin (green).
Figure 7
Figure 7
The effector encoding loci and psrA are required for persistence in a ruminant model of colonization. Six sheep were colonized with equal levels of the wild type (WT) and relevant mutant (ΔOI-50, ΔespK-X7, ΔpsrA) and shedding monitored from fecal samples over a three week period as described in Experimental Procedures. Shedding of wildtype TUV93-0 (light grey circles) and (A) the OI-50 mutant (dark grey circles), (D) the espK to espX7 mutant (dark grey circles) and (G) the psrA mutant (dark grey circles). NegE indicates samples that were tested by enrichment but remained negative for detection of the bacteria. Preliminary analysis indicated an effect of the mutations on persistence. To quantify this, cumulative bacterial counts for the individual weeks were compared and data is shown for the 3rd week of this analysis (B,E & H) for the indicated strains. As these are competitive index experiments data is only shown for animals in which the WT strain was still shedding at the end of the three week period. Graphs C, F & I show the level of reduction of the mutant strain vs. the WT. The minimum reduction (%) between the WT and indicated mutant is also shown in each graph.

Similar articles

Cited by

References

    1. Abe H, Miyahara A, Oshima T, Tashiro K, Ogura Y, Kuhara S, Ogasawara N, Hayashi T, Tobe T. Global regulation by horizontally transferred regulators establishes the pathogenicity of Escherichia coli. DNA Res. 2008;15:25–38. - PMC - PubMed
    1. Beloin C, Valle J, Latour-Lambert P, Faure P, Kzreminski M, Balestrino D, Haagensen JA, Molin S, Prensier G, Arbeille B, Ghigo JM. Global impact of mature biofilm lifestyle on Escherichia coli K-12 gene expression. Mol Microbiol. 2004;51:659–674. - PubMed
    1. Best A, Clifford D, Crudgington B, Cooley WA, Nunez A, Carter B, Weyer U, Woodward MJ, La Ragione RM. Intermittent Escherichia coli O157:H7 colonisation at the terminal rectum mucosa of conventionally-reared lambs. Vet Res. 2009;40:9. - PMC - PubMed
    1. Bustamante VH, Santana FJ, Calva E, Puente JL. Transcriptional regulation of type III secretion genes in enteropathogenic Escherichia coli: Ler antagonizes H-NS-dependent repression. Mol Microbiol. 2001;39:664–678. - PubMed
    1. Campellone KG, Robbins D, Leong JM. EspF(U) is a translocated EHEC effector that interacts with Tir and N-WASP and promotes nck-independent actin assembly. Developmental Cell. 2004;7:217–228. - PubMed

Publication types

MeSH terms