. 2011 Apr 14:11:92.
doi: 10.1186/1471-2334-11-92.

Onset of a pandemic: characterizing the initial phase of the swine flu (H1N1) epidemic in Israel

Affiliations

Onset of a pandemic: characterizing the initial phase of the swine flu (H1N1) epidemic in Israel

Uri Roll et al. BMC Infect Dis. .

Abstract

Background: The swine influenza H1N1 first identified in Mexico, spread rapidly across the globe and is considered the fastest moving pandemic in history. The early phase of an outbreak, in which data is relatively scarce, presents scientific challenges on key issues such as: scale, severity and immunity which are fundamental for establishing sound and rapid policy schemes. Our analysis of an Israeli dataset aims at understanding the spatio-temporal dynamics of H1N1 in its initial phase.

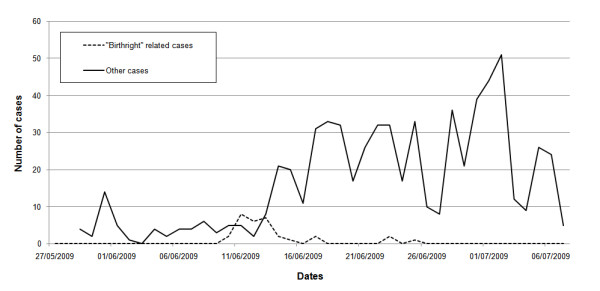
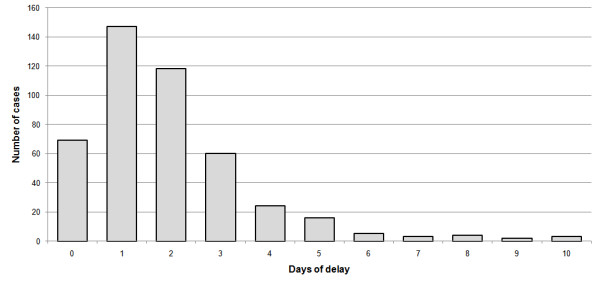
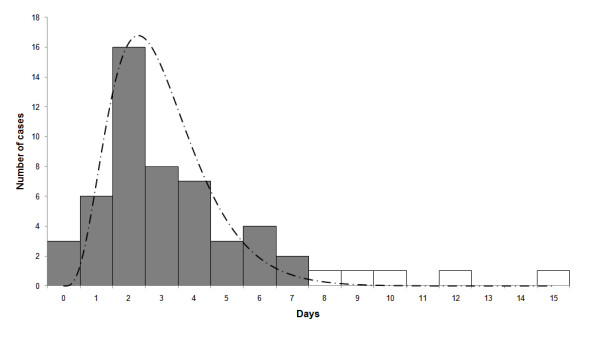
Methods: We constructed and analyzed a unique dataset from Israel on all confirmed cases (between April 26 to July 7, 2009), representing most swine flu cases in this period. We estimated and characterized fundamental epidemiological features of the pandemic in Israel (e.g. effective reproductive number, age-class distribution, at-risk social groups, infections between sexes, and spatial dynamics). Contact data collected during this stage was used to estimate the generation time distribution of the pandemic.

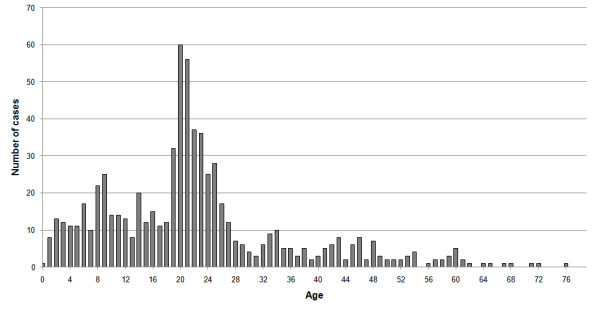
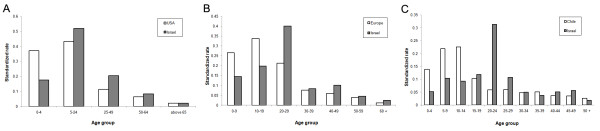
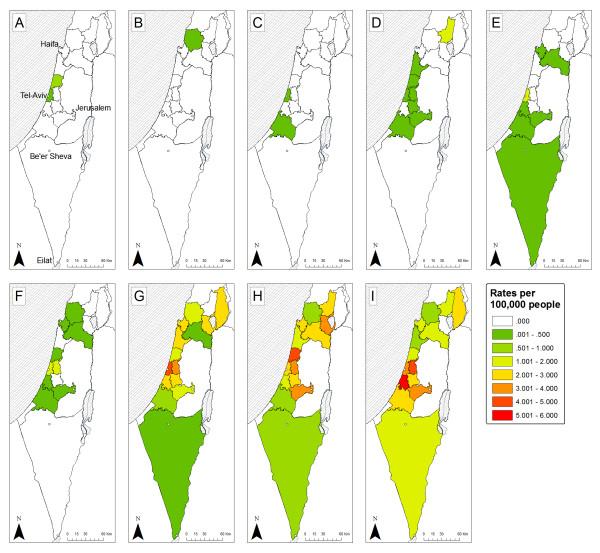
Results: We found a low effective reproductive number (Re=1.06), an age-class distribution of infected individuals (skewed towards ages 18-25), at-risk social groups (soldiers and ultra Orthodox Jews), and significant differences in infections between sexes (skewed towards males). In terms of spatial dynamics, the pandemic spread from the central coastal plain of Israel to other regions, with higher infection rates in more densely populated sub-districts with higher income households.

Conclusions: Analysis of high quality data holds much promise in reducing uncertainty regarding fundamental aspects of the initial phase of an outbreak (e.g. the effective reproductive number Re, age-class distribution, at-risk social groups). The formulation for determining the effective reproductive number Re used here has many advantages for studying the initial phase of the outbreak since it neither assumes exponential growth of infectives and is independent of the reporting rate. The finding of a low Re (close to unity threshold), combined with identification of social groups with high transmission rates would have enabled the containment of swine flu during the summer in Israel. Our unique use of contact data provided new insights into the differential dynamics of influenza in different ages and sexes, and should be promoted in future epidemiological studies. Thus our work highlights the importance of conducting a comprehensive study of the initial stage of a pandemic in real time.


Figures

Figure 1
Figure 1
Time series of swine flu in Israel. a- time series of swine flu cases in Israel between the 26/4/2009 and the 7/7/2009, altogether 713 cases. Bars represent the incidences per day (left Y-bar scale) and line the cumulative number (right Y-bar scale). Also marked is the date when the systematic data collection ended (dashed line). b- Percentage of primary versus secondary cases over the epidemic from the 20th of May onwards.
Figure 2
Figure 2
"Birthright" influence on spread. Influence of the group of young American students (from the "Birthright" project) on time series of swine flu cases in Israel. The dashed line shows all the cases that were either group members or identified themselves as being in contact with the "Birthright" group. The solid line displays the rest of the cases.
Figure 3
Figure 3
Delay between disease initiation and doctor visit. Frequency distribution of the number of days of delay between the reported initiation of the disease and the visit to the health clinic or hospital (N = 451).
Figure 4
Figure 4
The number of swine flu cases at each age.
Figure 5
Figure 5
Age distribution of cases in different countries. Standardized rates of swine flu in different age classes and different countries. The number of cases in each age class is divided by total population in these ages, and these rates are later divided by the sum of all of the rates in all age classes. These rates were calculated for the USA - A (confirmed cases from the 15/4-24/7/2009 Based on [55]), Europe - B (confirmed cases up to the 20/7/2009 based on [17]) and Chile - C (all confirmed cases up to the 2/7/2009 based on [7]) and compared to their parallel rates in Israel.
Figure 6
Figure 6
Time series of swine flu cases divided into three different age groups.
Figure 7
Figure 7
Frequency distribution of the swine flu generation time. This is based on differences in reported disease initiation dates that were calculated from our infection networks. Also displayed is a Gamma distribution curve (dashed line) based on data only up to seven days - dark bars (see text for details).
Figure 8
Figure 8
Spatial spread of swine flu in sub-districts of Israel. The data are combined for each week up to week ten of the epidemic (week three had no cases in it and therefore isn't displayed). The color of the region represents its rate of Influenza, from dark green - low rate (up to 0.5 cases per 100,000 people) to red- high rate (5-6 cases per 100,000 people). The panes represent different weeks (A-first 26/4-2/5/2009, B-second 3-9/5/2009, C-fourth 17-23/5/2009, D-fifth 24-30/5/2009, E-sixth 31/5-6/6/2009, F-seventh 7-13/6/2009, G-eighth 14-20/6/2009, H-ninth 21-27/6/2009, I-tenth 28/6-4/7/2009). Also on the map five major cities of Israel are marked as dots; the cities are (from north to south): Haifa, Tel-Aviv, Jerusalem, Be'er-Sheva, Eilat.

Similar articles

Cited by

References

    1. Pandemic (H1N1) 2009 - update 58. http://www.who.int/csr/don/2009_07_06/en/index.html
    1. Lipsitch M, Riley S, Cauchemez S, Ghani AC, Ferguson NM. Managing and Reducing Uncertainty in an Emerging Influenza Pandemic. New England Journal of Medicine. 2009;361(2):112–115. doi: 10.1056/NEJMp0904380. - DOI - PMC - PubMed
    1. Flahault A, Vergu E, Boelle PY. Potential for a global dynamic of Influenza A (H1N1) Bmc Infectious Diseases. 2009;9 doi: 10.1186/1471-2334-9-129. - DOI - PMC - PubMed
    1. Morens DM, Taubenberger JK. Understanding Influenza Backward. Jama-Journal of the American Medical Association. 2009;302(6):679–680. doi: 10.1001/jama.2009.1127. - DOI - PMC - PubMed
    1. Dawood FS, Jain S, Finelli L, Shaw MW, Lindstrom S, Garten RJ, Gubareva LV, Xu XY, Bridges CB, Uyeki TM. Emergence of a Novel Swine-Origin Influenza A (H1N1) Virus in Humans Novel Swine-Origin Influenza A (H1N1) Virus Investigation Team. New England Journal of Medicine. 2009;360(25):2605–2615. doi: 10.1056/NEJMoa0903810. - DOI - PubMed

Publication types

MeSH terms