. 2011 Apr 14:11:9.
doi: 10.1186/1475-2867-11-9.

A 6-gene signature identifies four molecular subgroups of neuroblastoma

Affiliations

A 6-gene signature identifies four molecular subgroups of neuroblastoma

Frida Abel et al. Cancer Cell Int. .

Abstract

Background: There are currently three postulated genomic subtypes of the childhood tumour neuroblastoma (NB); Type 1, Type 2A, and Type 2B. The most aggressive forms of NB are characterized by amplification of the oncogene MYCN (MNA) and low expression of the favourable marker NTRK1. Recently, mutations or high expression of the familial predisposition gene Anaplastic Lymphoma Kinase (ALK) was associated to unfavourable biology of sporadic NB. Also, various other genes have been linked to NB pathogenesis.

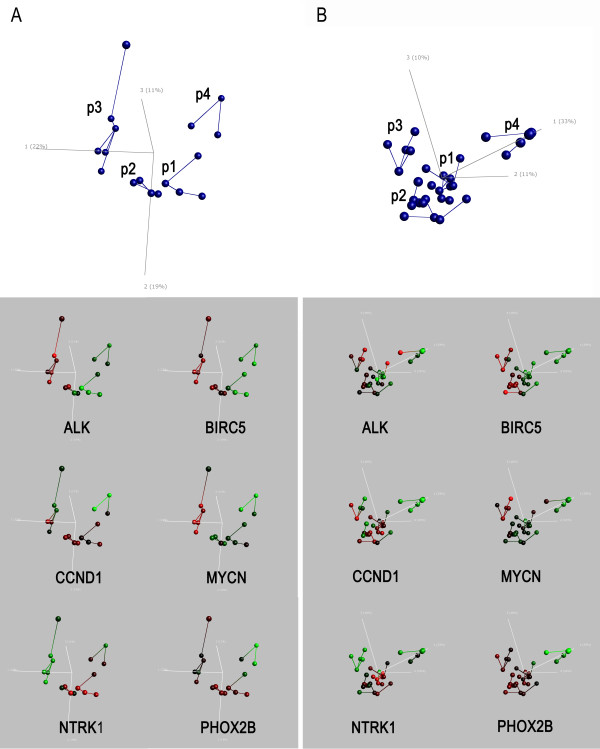
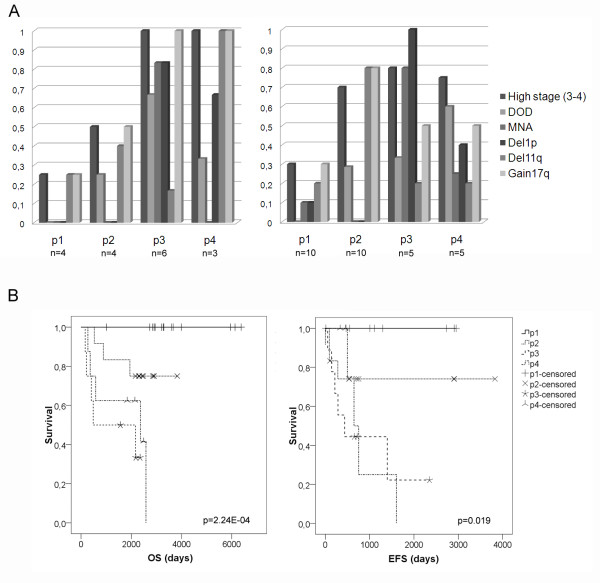
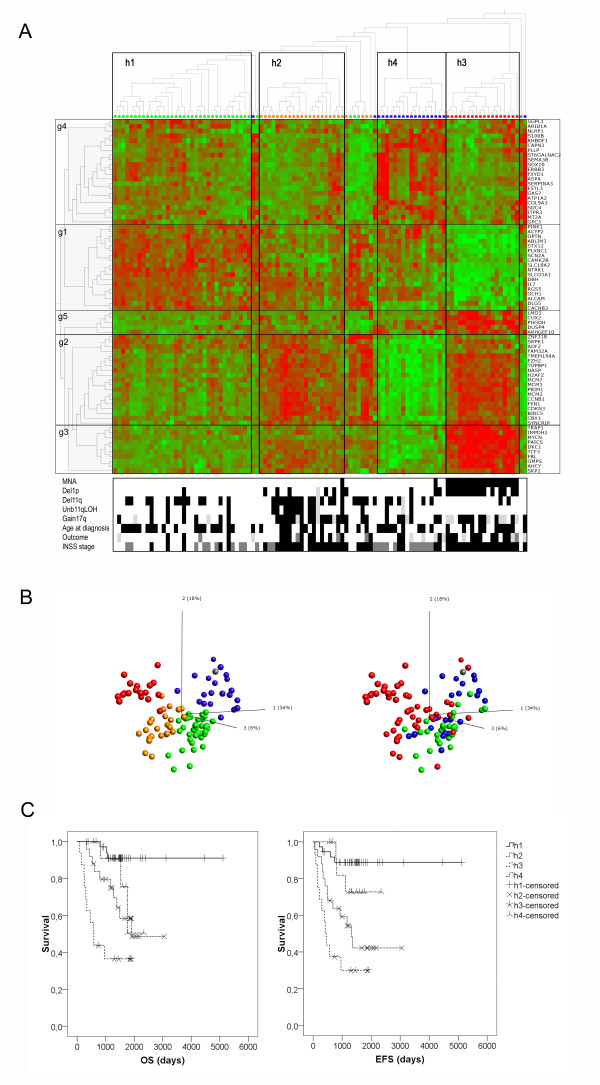
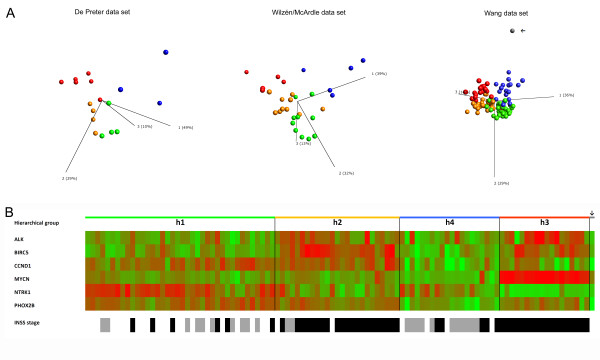
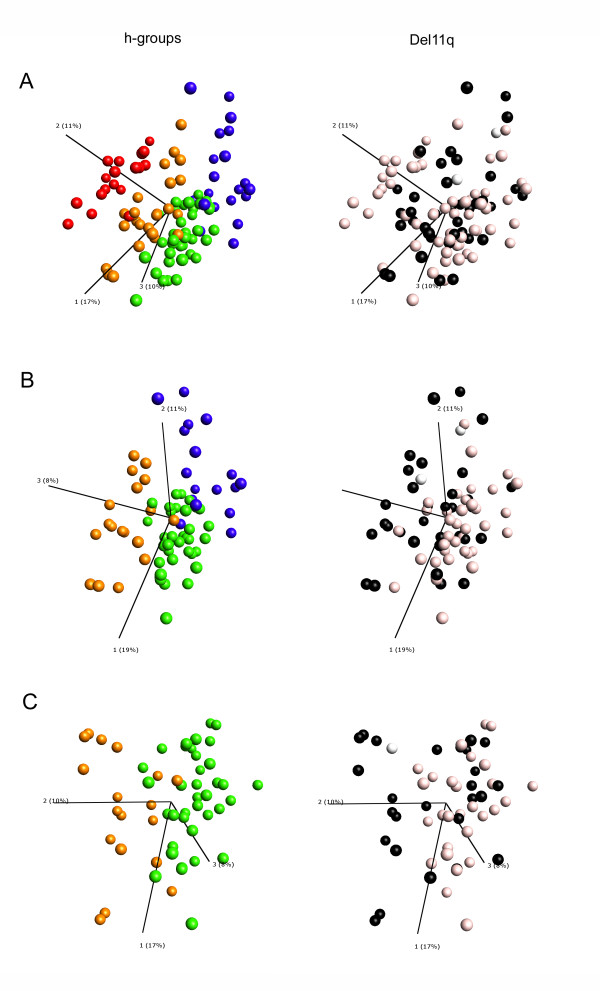
Results: The present study explores subgroup discrimination by gene expression profiling using three published microarray studies on NB (47 samples). Four distinct clusters were identified by Principal Components Analysis (PCA) in two separate data sets, which could be verified by an unsupervised hierarchical clustering in a third independent data set (101 NB samples) using a set of 74 discriminative genes. The expression signature of six NB-associated genes ALK, BIRC5, CCND1, MYCN, NTRK1, and PHOX2B, significantly discriminated the four clusters (p < 0.05, one-way ANOVA test). PCA clusters p1, p2, and p3 were found to correspond well to the postulated subtypes 1, 2A, and 2B, respectively. Remarkably, a fourth novel cluster was detected in all three independent data sets. This cluster comprised mainly 11q-deleted MNA-negative tumours with low expression of ALK, BIRC5, and PHOX2B, and was significantly associated with higher tumour stage, poor outcome and poor survival compared to the Type 1-corresponding favourable group (INSS stage 4 and/or dead of disease, p < 0.05, Fisher's exact test).

Conclusions: Based on expression profiling we have identified four molecular subgroups of neuroblastoma, which can be distinguished by a 6-gene signature. The fourth subgroup has not been described elsewhere, and efforts are currently made to further investigate this group's specific characteristics.


Figures

Figure 1
Figure 1
PCA plots of two parallel cluster analyses. Principal Components Analysis (PCA) of the two test groups using a variance cut-off of 0.4. A. HU133A De Preter data set (414 variables, 17 tumour samples, [22]). B. HU133A McArdle/Wilzén data sets (716 variables, 30 tumour samples, [25,59]). Upper panel: PCA clusters, samples (spheres) are joined by nearest Euclidean neighbour. Lower panel: Expression of six NB associated genes Red = High expression; Green = Low expression. The colour scale is based on standard deviations (SD) and ranges from +2 SD (red) to -2 SD (green).
Figure 2
Figure 2
Frequency of prognostic factors and survival probability in PCA clusters. A. The frequency of prognostic factors in the four PCA clusters p1-p4 for the De Preter data set (n = 17) and McArdle/Wilzén (n = 30). High stage (3-4) = INSS stage 3 and 4; DOD = Dead of disease; MNA = MYCN amplification; Del = deletion. Significant occurrence of prognostic factors in one PCA cluster compared to the others is marked with stars (Fisher's exact test). n = the number of samples in each subgroup. B. Kaplan Meier survival curves of PCA clusters (p1-p4) from three data sets (De Preter, McArdle, and Wilzén). OS = Overall survival (n = 43). EFS = Event-free survival (n = 35). Chi-square significance by Log-rank (Mantel-Cox).
Figure 3
Figure 3
Hierarchical clustering using a 74 discriminative gene set. A. Unsupervised hierarchal clustering of the Affymetrix HGU95Av2 Wang data set (102 tumour samples in total [28]) by the 74-gene set. The heat map colour scale is based on standard deviations (sd) and ranges from +2 sd (red) to -2 sd (green). The five gene clusters seen are named g1-g5. Status of eight prognostic factors is shown by black and white squares in the lower part: Outcome = Dead of disease; MNA = MYCN amplification; Del = deletion. Black = event, White = No event, Light grey = Not determined. INSS stage is marked as follows: Black = stage 4, dark grey = stage 3. The four hierarchical subgroups seen in the heat map are marked by colour dots: Green = Hierarchical cluster 1 (h1), Orange = h2, Blue = h4, Red = h3, Grey = Human fetal brain. B. PCA plot of the 74-classifier gene-set. Left panel: the four hierarchical clusters colour-coded according to the Hierarchical clustering (see above). Right panel: three INSS stages: Green = stage 1, Blue = stage 3, Red = stage 4, Grey = Human fetal brain. C. Kaplan Meier survival curves of hierarchical clusters (h1-h4) from the Wang data set. OS = Overall survival (n = 92). EFS = Event-free survival (n = 92). Chi-square significance by Log-rank (Mantel-Cox).
Figure 4
Figure 4
Verification of 6-gene signature. A. PCA of the six NB associated genes ALK, BIRC5, CCND1, MYCN, NTRK1, and PHOX2B on three data sets: De Preter (left panel), McArdle/Wilzén (middle panel), and Wang (right panel). Samples (spheres) in the two test data sets (De Preter and McArdle/Wilzén) are coloured by the PCA clusters: Green = p1, Orange = p2, Red = p3, and Blue = p4. Samples (spheres) in the Wang data set are coloured by the hierarchical subgroups: Green = h1, Orange = h2, Blue = h4, and Red = h3, Grey = Human fetal brain. Human fetal brain (marked with an arrow) is distinct from the 101 NB samples. B. Expression heat map of the 6-gene signature of the Wang data set. The colour scale is based on standard deviations (SD) and ranges from +2 SD (red) to -2 SD (green). Samples are presented in the same order as in Figure 3A.
Figure 5
Figure 5
Del11q groups of the Wang data set. Unfiltered PCA plots of the Wang data set (101 NB samples, 7542 genes). The four hierarchical clusters (h-groups) in panels A-C (left) are colour-coded as follows: Green = h1, Orange = h2, Red = h3, Blue = h4. Del11q genetic aberrations in panels A-C (right) are colour-coded as follows: Black = 11q-deletion, off-white = No 11q-deletion, White = Undetermined. A. PCA of all 101 neuroblastoma cases. B. PCA of 74 cases without MNA and Del1p C. PCA of 55 cases of the hierarchical groups h1 and h2 without MNA and Del1p.

Similar articles

Cited by

References

    1. Brodeur GM, Pritchard J, Berthold F, Carlsen NL, Castel V, Castelberry RP, De Bernardi B, Evans AE, Favrot M, Hedborg F. et al.Revisions of the international criteria for neuroblastoma diagnosis, staging, and response to treatment. J Clin Oncol. 1993;11:1466–1477. - PubMed
    1. Breslow N, McCann B. Statistical estimation of prognosis for children with neuroblastoma. Cancer Res. 1971;31:2098–2103. - PubMed
    1. Shimada H, Ambros IM, Dehner LP, Hata J, Joshi VV, Roald B, Stram DO, Gerbing RB, Lukens JN, Matthay KK, Castleberry RP. The International Neuroblastoma Pathology Classification (the Shimada system) Cancer. 1999;86:364–372. doi: 10.1002/(SICI)1097-0142(19990715)86:2<364::AID-CNCR21>3.0.CO;2-7. - DOI - PubMed
    1. Seeger RC, Brodeur GM, Sather H, Dalton A, Siegel SE, Wong KY, Hammond D. Association of multiple copies of the N-myc oncogene with rapid progression of neuroblastomas. N Engl J Med. 1985;313:1111–1116. doi: 10.1056/NEJM198510313131802. - DOI - PubMed
    1. Look AT, Hayes FA, Shuster JJ, Douglass EC, Castleberry RP, Bowman LC, Smith EI, Brodeur GM. Clinical relevance of tumor cell ploidy and N-myc gene amplification in childhood neuroblastoma: a Pediatric Oncology Group study. J Clin Oncol. 1991;9:581–591. - PubMed