Clinical Trial
. 2011 Jun;134(Pt 6):1790-807.
doi: 10.1093/brain/awr063. Epub 2011 Apr 14.

Intravenous administration of auto serum-expanded autologous mesenchymal stem cells in stroke

Affiliations
Clinical Trial

Intravenous administration of auto serum-expanded autologous mesenchymal stem cells in stroke

Osamu Honmou et al. Brain. 2011 Jun.

Abstract

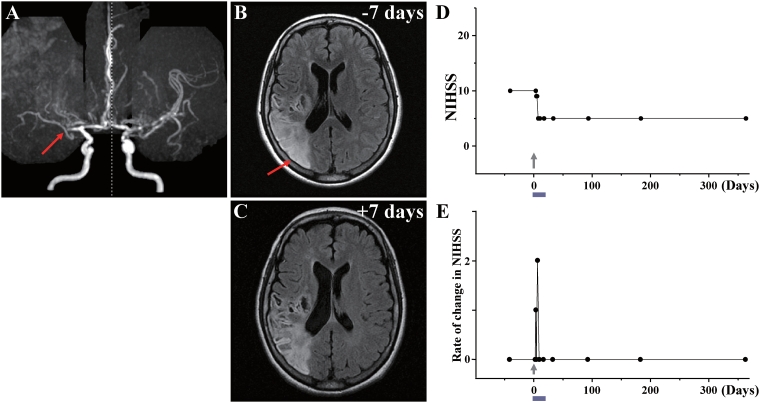
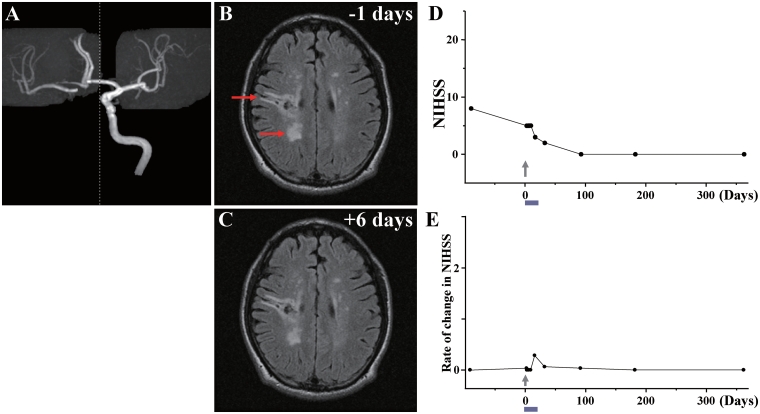
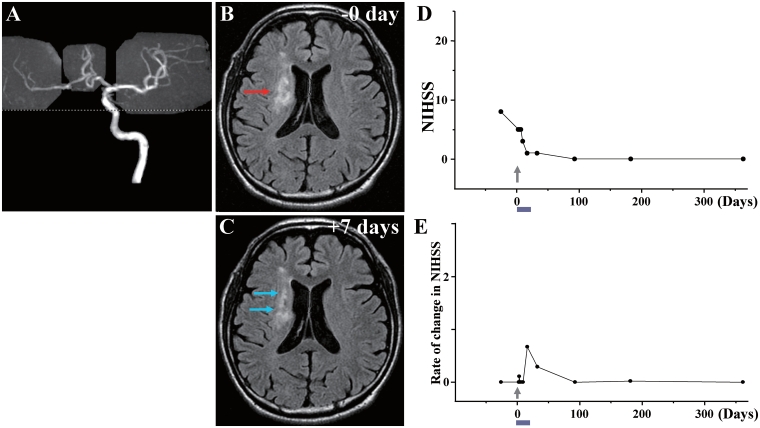
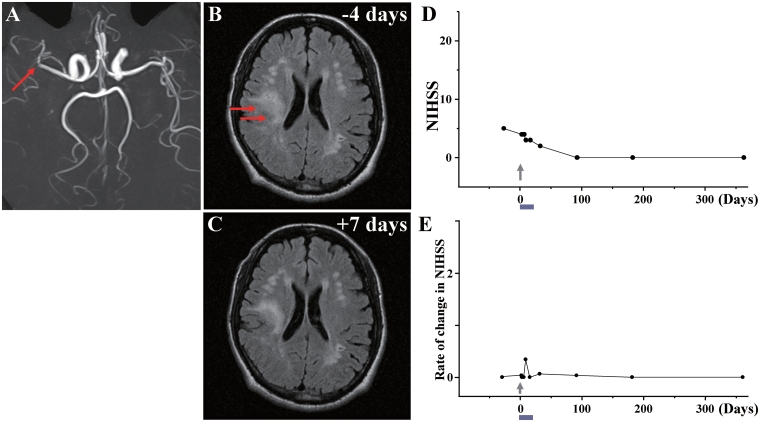
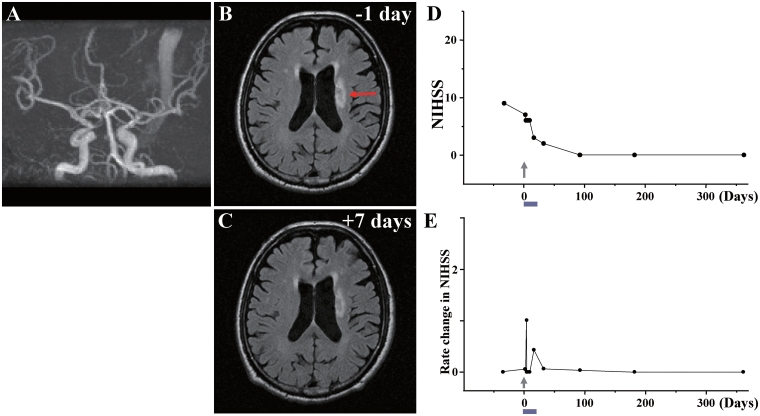
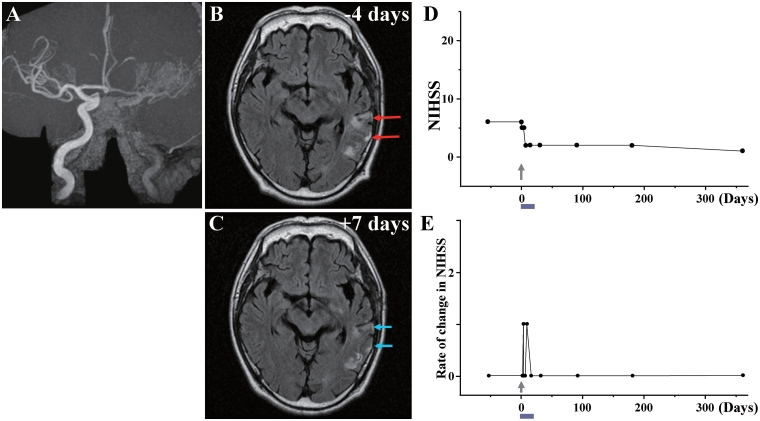
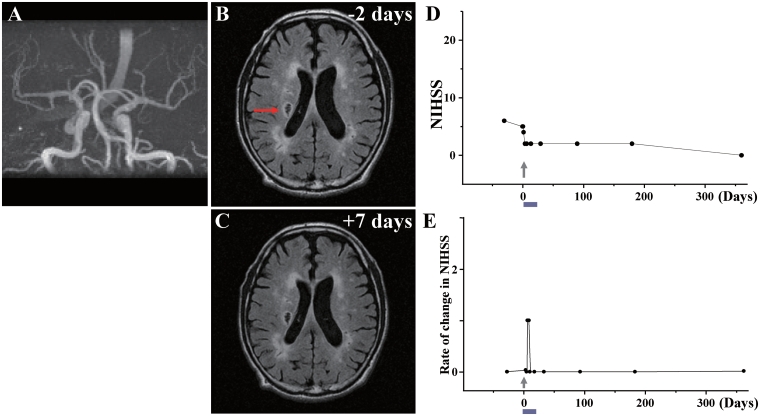
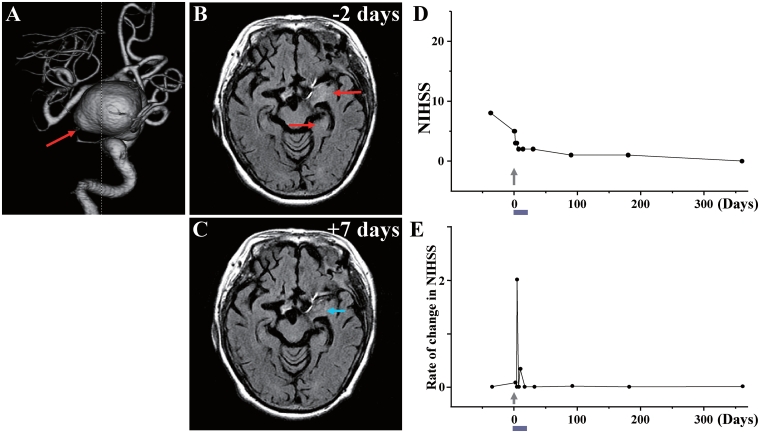
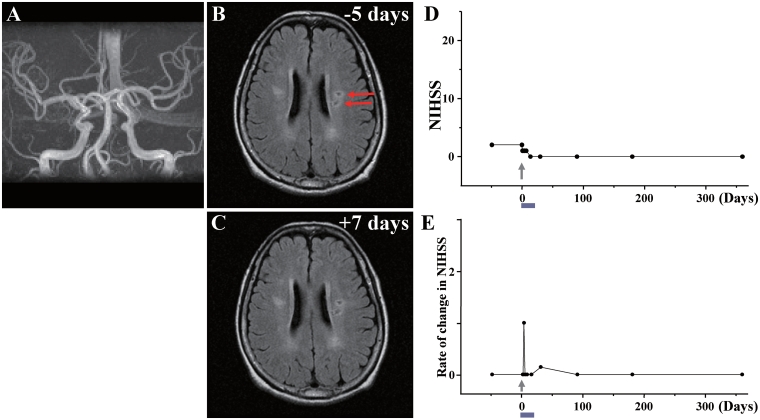
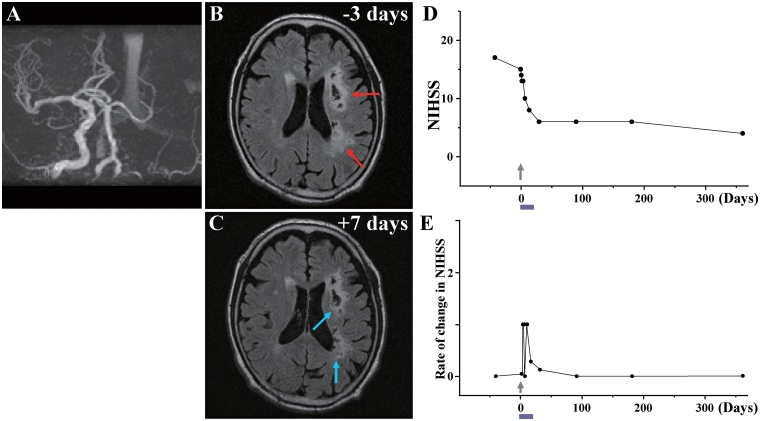
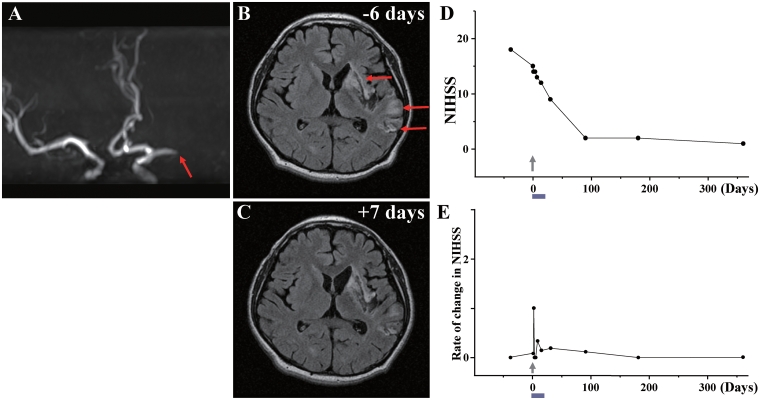
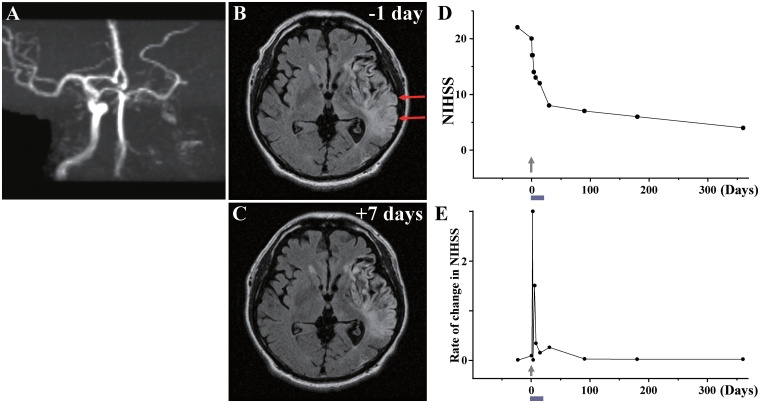
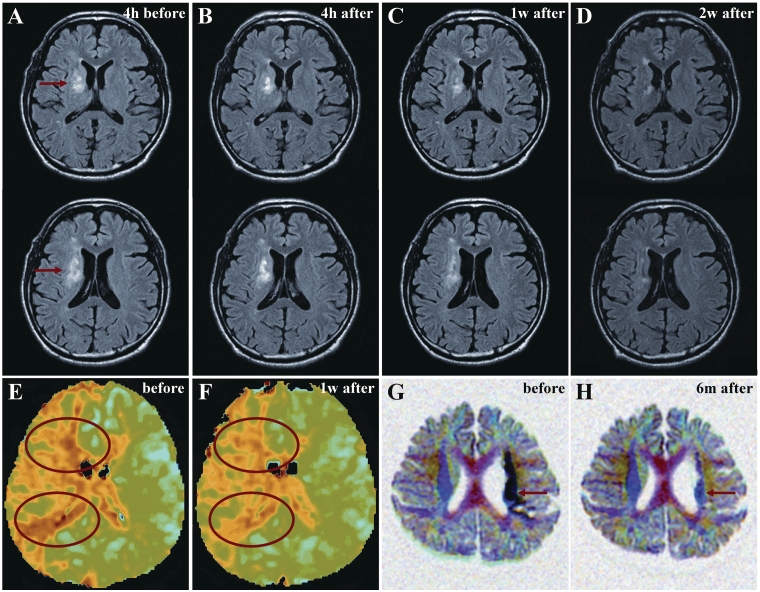
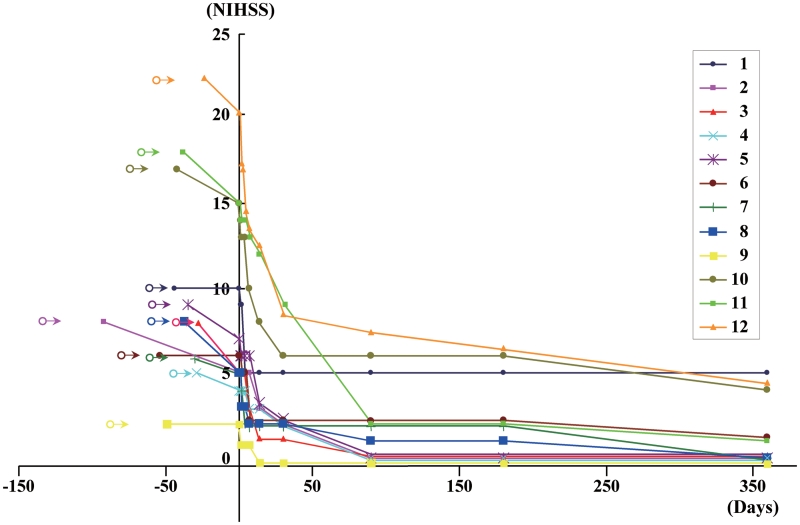
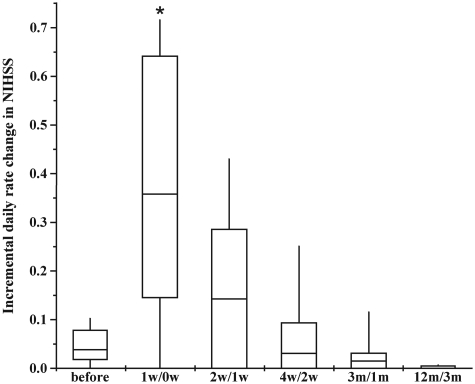
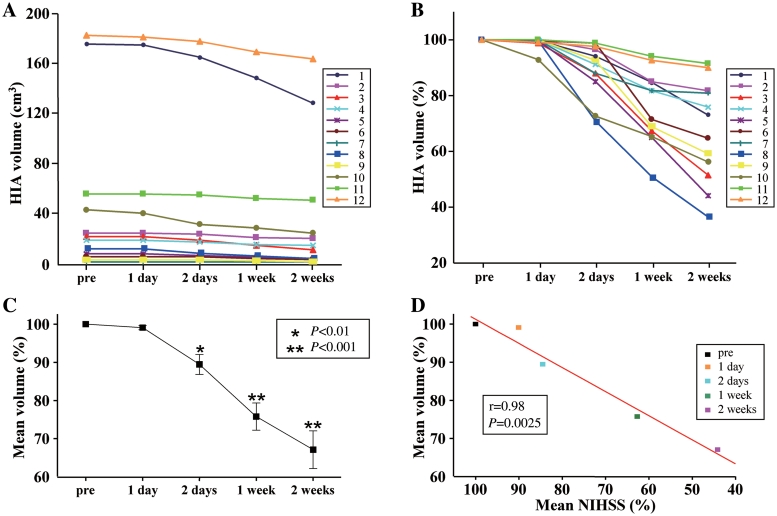
Transplantation of human mesenchymal stem cells has been shown to reduce infarct size and improve functional outcome in animal models of stroke. Here, we report a study designed to assess feasibility and safety of transplantation of autologous human mesenchymal stem cells expanded in autologous human serum in stroke patients. We report an unblinded study on 12 patients with ischaemic grey matter, white matter and mixed lesions, in contrast to a prior study on autologous mesenchymal stem cells expanded in foetal calf serum that focused on grey matter lesions. Cells cultured in human serum expanded more rapidly than in foetal calf serum, reducing cell preparation time and risk of transmissible disorders such as bovine spongiform encephalomyelitis. Autologous mesenchymal stem cells were delivered intravenously 36-133 days post-stroke. All patients had magnetic resonance angiography to identify vascular lesions, and magnetic resonance imaging prior to cell infusion and at intervals up to 1 year after. Magnetic resonance perfusion-imaging and 3D-tractography were carried out in some patients. Neurological status was scored using the National Institutes of Health Stroke Scale and modified Rankin scores. We did not observe any central nervous system tumours, abnormal cell growths or neurological deterioration, and there was no evidence for venous thromboembolism, systemic malignancy or systemic infection in any of the patients following stem cell infusion. The median daily rate of National Institutes of Health Stroke Scale change was 0.36 during the first week post-infusion, compared with a median daily rate of change of 0.04 from the first day of testing to immediately before infusion. Daily rates of change in National Institutes of Health Stroke Scale scores during longer post-infusion intervals that more closely matched the interval between initial scoring and cell infusion also showed an increase following cell infusion. Mean lesion volume as assessed by magnetic resonance imaging was reduced by >20% at 1 week post-cell infusion. While we would emphasize that the current study was unblinded, did not assess overall function or relative functional importance of different types of deficits, and does not exclude placebo effects or a contribution of recovery as a result of the natural history of stroke, our observations provide evidence supporting the feasibility and safety of delivery of a relatively large dose of autologous mesenchymal human stem cells, cultured in autologous human serum, into human subjects with stroke and support the need for additional blinded, placebo-controlled studies on autologous mesenchymal human stem cell infusion in stroke.


Figures

Figure 1
Figure 1
Case 1: (A) MRA showed occlusion of the right middle cerebral artery (red arrow). (B) MRI 7 days before cell injection and (C) 7 days after cell injection are shown. Red arrow in B indicates the infarcted lesion. (D) NIHSS scores for 1 year. (E) Rate of change in NIHSS for each day plotted. For example, the rate of change in NIHSS score at Day X was calculated as (NIHSS score on previous examination—NIHSS score on Day X)/number of days between examinations, to give an estimate of the daily rate of change.
Figure 2
Figure 2
Case 2: (A) MRA showed occlusion of the right internal carotid artery. (B) MRI 1 day before cell injection and (C) 6 days after cell injection. Red arrows in B indicate the infarcted lesions. (D) NIHSS scores for 1 year and (E) rate of change in NIHSS.
Figure 3
Figure 3
Case 3: (A) MRA showed occlusion of the right internal carotid artery. (B) MRI just before cell injection and (C) 7 days after cell injection. Red arrow in B indicates the infarcted lesion before cell injection, and blue arrows in C show the reduced lesion volume and lower signal intensity after cell injection. (D) NIHSS scores for 1 year and (E) rate of change in NIHSS.
Figure 4
Figure 4
Case 4: (A) MRA showed occlusion of a branch of the right middle cerebral artery (red arrow). (B) MRI 4 days before cell injection and (C) 7 days after cell injection. Red arrows in B indicate the infarcted lesion. (D) NIHSS scores for 1 year and (E) rate of change in NIHSS.
Figure 5
Figure 5
Case 5: (A) MRA showed that major cerebral arteries were intact. (B) MRI 1 day before cell injection and (C) 7 days after cell injection. Red arrow in B indicates the infarcted lesion. (D) NIHSS scores 1 year and (E) rate of change in NIHSS.
Figure 6
Figure 6
Case 6: (A) MRA showed occlusion of the left internal carotid artery. (B) MRI 4 days before cell injection and (C) 7 days after cell injection. Red arrows in B indicate the infarcted lesions before cell injection, and blue arrows in C show the reduced lesion volume and lower signal intensity after cell injection. (D) NIHSS scores for 1 year and (E) rate of change in NIHSS.
Figure 7
Figure 7
Case 7: (A) MRA showed that major cerebral arteries were intact. (B) MRI 2 days before cell injection and (C) 7 days after cell injection. Red arrow in B indicates the infarcted lesion. (D) NIHSS scores for 1 year and (E) rate of change in NIHSS.
Figure 8
Figure 8
Case 8: (A) 3D-CT angiography showed the large aneurysm (red arrow) in the left internal carotid artery. (B) MRI 2 days before cell injection and (C) 7 days after cell injection. Red arrows in B indicate the infarcted lesions before cell injection, and blue arrow in C shows the reduced lesion volume and lower signal intensity after cell injection. (D) NIHSS scores for 1 year and (E) rate of change in NIHSS.
Figure 9
Figure 9
Case 9: (A) MRA showed that major cerebral arteries were intact. (B) MRI 5 days before cell injection and (C) 7 days after cell injection. Red arrows in B indicate the infarcted lesions. (D) NIHSS scores for 1 year and (E) rate of change in NIHSS.
Figure 10
Figure 10
Case 10: (A) MRA showed occlusion of the left internal carotid artery. (B) MRI 3 days before cell injection and (C) 7 days after cell injection. Red arrows in B indicate the infarcted lesions before cell injection, and blue arrows in C show the reduced lesion volume and lower signal intensity after cell injection. (D) NIHSS scores for 1 year and (E) rate of change in NIHSS.
Figure 11
Figure 11
Case 11: (A) MRA showed occlusion of the left middle cerebral artery (red arrow). (B) MRI 6 days before cell injection and (C) 7 days after cell injection. Red arrows in B indicate the infarcted lesions. (D) NIHSS scores for 1 year and (E) rate of change in NIHSS.
Figure 12
Figure 12
Case 12: (A) MRA showed occlusion of the left internal carotid artery. (B) MRI 1 day before cell injection and (C) 7 days after cell injection. Red arrows in B indicate the infarcted lesion. (D) NIHSS scores for 1 year and (E) rate of change in NIHSS.
Figure 13
Figure 13
(A) MRIs from Case 3 4 h before cell injection and (B) 4 h, (C) 1 week and (D) 2 weeks after cell injection. Red arrows in A indicate the infarcted lesion. (E) Perfusion images from Case 3 before and (F) 1 week after cell injection. Red ovals show regions of interest. (G) 3D diffusion tensor axonography from Case 11 before and (H) 6 months after cell injection. The black signal in internal capsule (red arrows in G) reverted toward normal signal (red arrows in H).
Figure 14
Figure 14
NIHSS scores at the time of autologous human MSC infusion and for 1 year following autologous human MSC infusion for the 12 patients.
Figure 15
Figure 15
Median incremental daily rate of change in NIHSS (horizontal bars within boxes), interquartile ranges (boxes) and ranges (vertical lines) at several times before and after cell injection. *P < 0.001 compared with pre-infusion (before) rate.
Figure 16
Figure 16
(A) Summary of high intensity magnetic resonance (fluid attenuation inversion recovery) lesion volumes (HIA) for all cases, pre-infusion and at 1 day, 2 days, 1 week and 2 weeks post-infusion. (B) Data re-plotted to show % change in lesion volume. (C) Mean % change in lesion volume compared with pre-infusion for 1 and 2 days, 1 and 2 weeks post-infusion. *P < 0.01; **P < 0.001 compared with pre-infusion value. (D) Mean % change in lesion volume plotted against mean change in NIHSS, compared with pre-infusion values. The results are correlated with r = 0.98; P = 0.0025.

Similar articles

Cited by

References

    1. Abe K, Hayashi T, Itoyama Y. Amelioration of brain edema by topical application of glial cell line-derived neurotrophic factor in reperfused rat brain. Neurosci Lett. 1997;231:37–40. - PubMed
    1. Bang OY, Lee JS, Lee PH, Lee G. Autologous mesenchymal stem cell transplantation in stroke patients. Ann Neurol. 2005;57:874–82. - PubMed
    1. Boulenguez P, Liabeuf S, Bos R, Bras H, Jean-Xavier C, Brocard C, et al. Down-regulation of the potassium-chloride cotransporter KCC2 contributes to spasticity after spinal cord injury. Nat Med. 2010;16:302–7. - PubMed
    1. Chen J, Li Y, Wang L, Lu M, Zhang X, Chopp M. Therapeutic benefit of intracerebral transplantation of bone marrow stromal cells after cerebral ischemia in rats. J Neurol Sci. 2001;189:49–57. - PubMed
    1. Chen J, Zhang ZG, Li Y, Wang L, Xu YX, Gautam SC, et al. Intravenous administration of human bone marrow stromal cells induces angiogenesis in the ischemic boundary zone after stroke in rats. Circ Res. 2003;92:692–9. - PubMed

Publication types

MeSH terms