. 2011 Jun 10;286(23):20746-57.
doi: 10.1074/jbc.M111.230326. Epub 2011 Apr 14.

Determination of structural models of the complex between the cytoplasmic domain of erythrocyte band 3 and ankyrin-R repeats 13-24

Affiliations

Determination of structural models of the complex between the cytoplasmic domain of erythrocyte band 3 and ankyrin-R repeats 13-24

Sunghoon Kim et al. J Biol Chem. .

Abstract

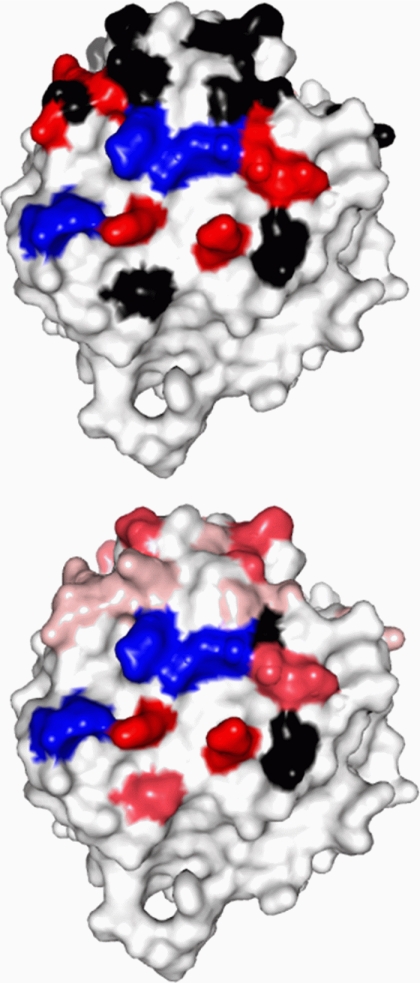
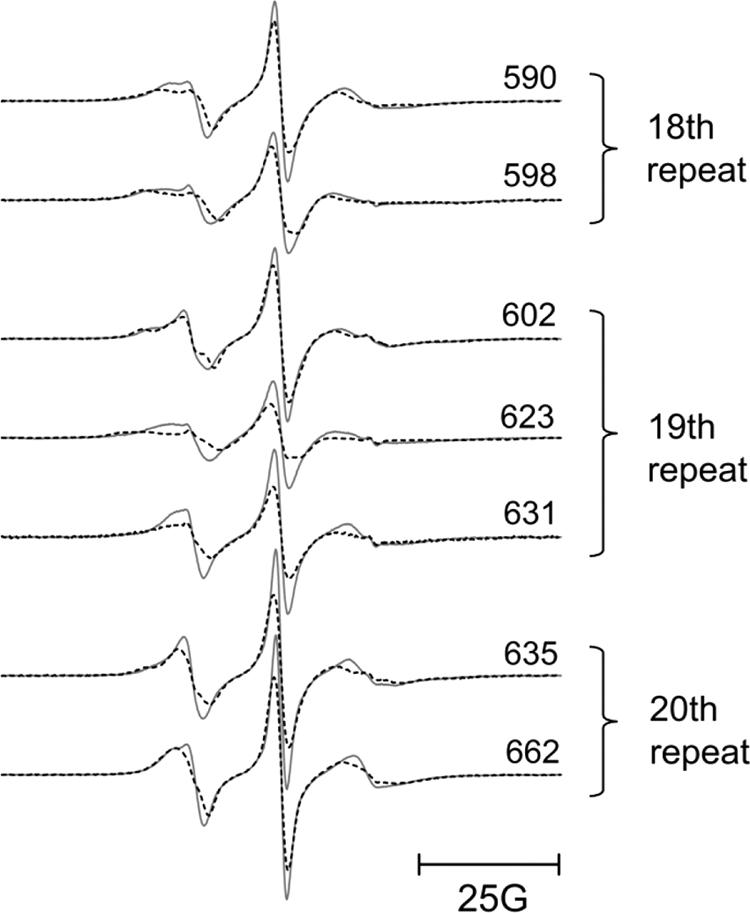
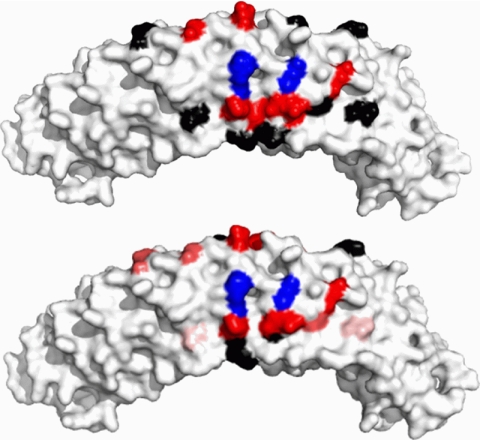
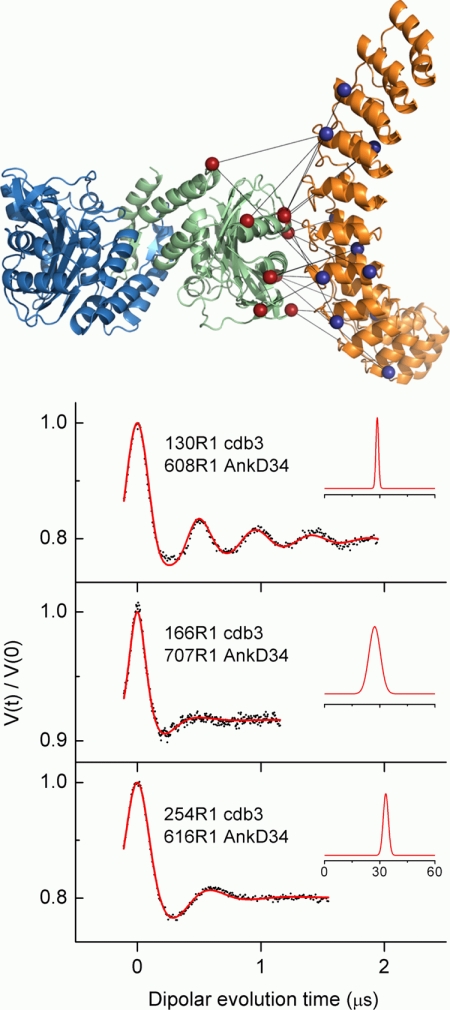
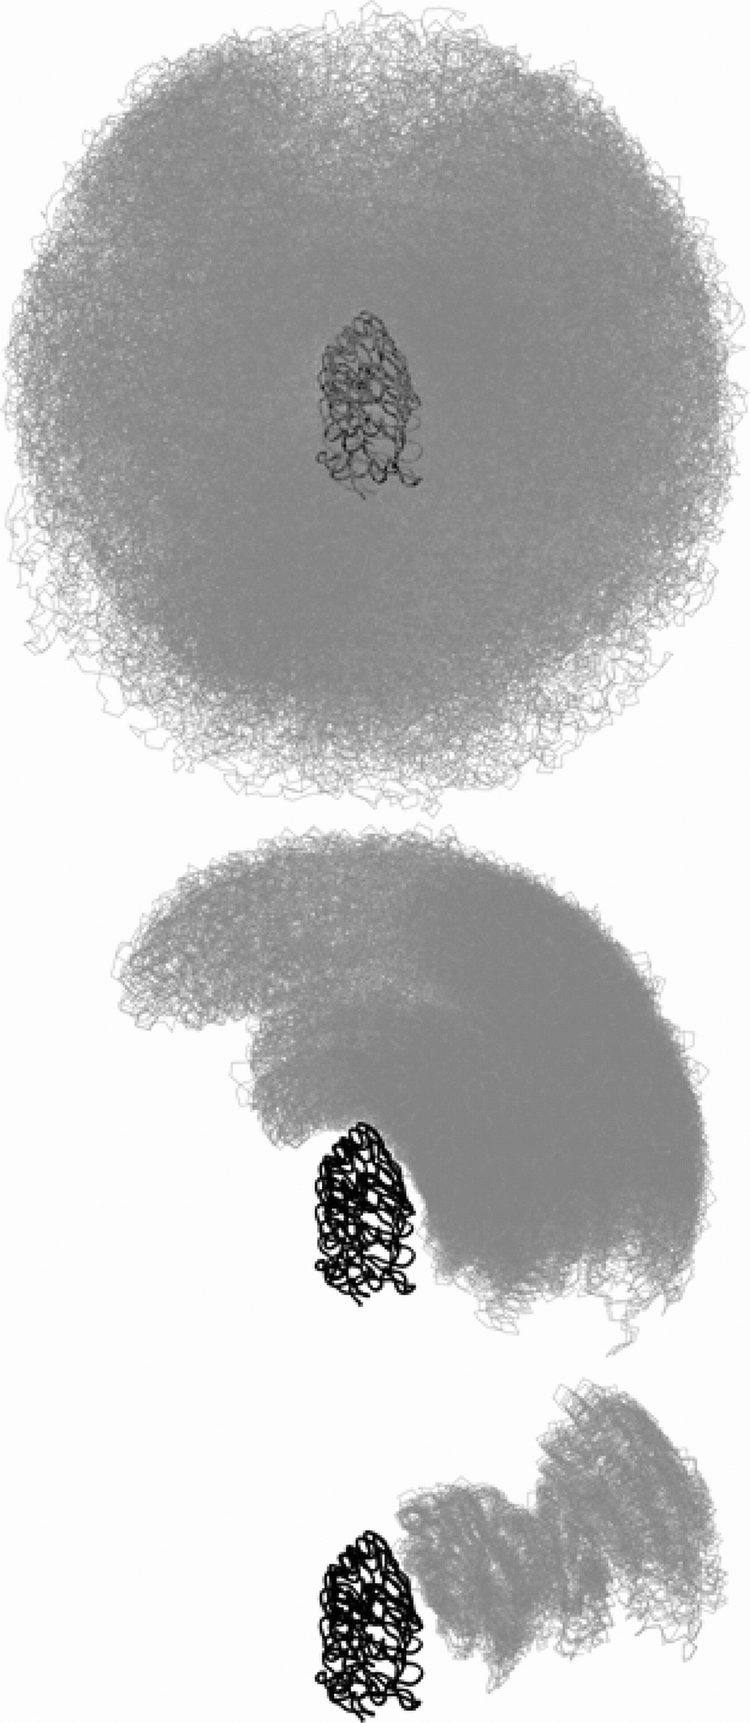
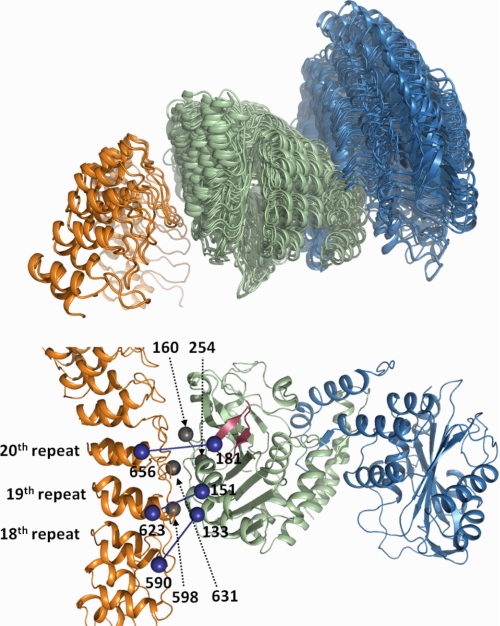
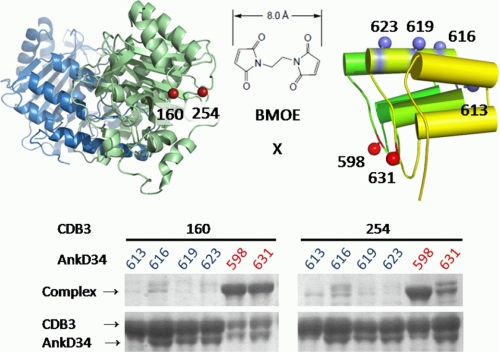
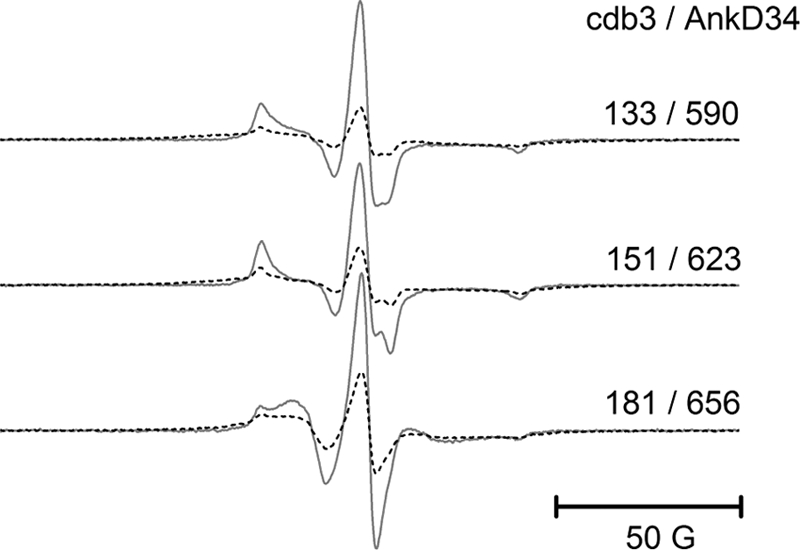
The adaptor protein ankyrin-R interacts via its membrane binding domain with the cytoplasmic domain of the anion exchange protein (AE1) and via its spectrin binding domain with the spectrin-based membrane skeleton in human erythrocytes. This set of interactions provides a bridge between the lipid bilayer and the membrane skeleton, thereby stabilizing the membrane. Crystal structures for the dimeric cytoplasmic domain of AE1 (cdb3) and for a 12-ankyrin repeat segment (repeats 13-24) from the membrane binding domain of ankyrin-R (AnkD34) have been reported. However, structural data on how these proteins assemble to form a stable complex have not been reported. In the current studies, site-directed spin labeling, in combination with electron paramagnetic resonance (EPR) and double electron-electron resonance, has been utilized to map the binding interfaces of the two proteins in the complex and to obtain inter-protein distance constraints. These data have been utilized to construct a family of structural models that are consistent with the full range of experimental data. These models indicate that an extensive area on the peripheral domain of cdb3 binds to ankyrin repeats 18-20 on the top loop surface of AnkD34 primarily through hydrophobic interactions. This is a previously uncharacterized surface for binding of cdb3 to AnkD34. Because a second dimer of cdb3 is known to bind to ankyrin repeats 7-12 of the membrane binding domain of ankyrin-R, the current models have significant implications regarding the structural nature of a tetrameric form of AE1 that is hypothesized to be involved in binding to full-length ankyrin-R in the erythrocyte membrane.


Figures

FIGURE 1.
FIGURE 1.
The spin-labeled side chain resulting from reaction of MTSSL with cysteine.
FIGURE 2.
FIGURE 2.
Inter-subunit distances between spin-labeled side chains of cdb3 before and after complex formation with AnkD34 measured by DEER. Three pairs of surface sites consisting of identical positions from each monomer were selected as depicted by the spheres (84 positions, red; 302 positions, orange; 340 positions, yellow) in the upper panel. The DEER data (black dots) and fits to the data (blue (before complex formation) and red (after complex formation)) are shown as solid lines in the stacked plots in the lower panel. The resultant average distances and distance distributions from fitting the data (Å) are shown in the insets.
FIGURE 3.
FIGURE 3.
Intra-protein distances in AnkD34 measured by DEER. The residue pairs are defined by the structure in the upper panel, and representative DEER data before and after complex formation with cdb3 are shown in the lower panel. The DEER data (black dots) and fits to the data before complex formation (blue) and after complex formation (red)red) are shown as solid lines in the stacked plots in the lower panel. The resultant average distances and distance distributions from fitting the data (Å) are shown in the insets.
FIGURE 4.
FIGURE 4.
Representative EPR spectra from spin-labeled side chains incorporated into the α2 helix (126, 127, and 130), the α3 helix (152), and the β6/7 hairpin loop (179, 180, and 183) in the peripheral domain of cdb3. The spectra in solid lines were recorded in the absence of wt-AnkD34. The superimposed spectra in dashed lines were recorded after complex formation with wt-AnkD34. Also shown are the data from sites 160 and 254, which lie outside these three structured domains but which showed significant changes upon binding of wt-AnkD34. There were no changes in EPR line shapes upon complex formation at sites 133, 134, 137, 140, and 141 in the α1 helix, at sites 148 and 151 in the α2 helix, and at site 181 in the β6/7 hairpin loop (data not shown). 25 G, 25 Gauss.
FIGURE 5.
FIGURE 5.
Changes in spin label side chain mobility (upper panel) and solvent accessibility (lower panel) as assessed by collision frequency with NiEDDA mapped onto the crystal structure of cdb3. The red residues in the upper panel showed a decrease in side chain mobility upon complex formation, the black residues showed no change, and the blue residues showed significantly impaired complex formation when the wt residue was changed to cysteine and spin-labeled with MTSSL. The same color scheme is used for the NiEDDA accessibility data in the lower panel for the black and blue residues, whereas the residues that showed changes in accessibility were displayed with three different colors based on their ΔΠ (Πcomplexcdb3) values (red, ΔΠ < −15.0; hot pink, −15.0 ≤ ΔΠ < −5.0; pale pink, −5.0 ≤ ΔΠ < −2.0).
FIGURE 6.
FIGURE 6.
Representative EPR spectra from spin-labeled side chains incorporated into the top loop regions of ankyrin repeat 18 (590 and 598), ankyrin repeat 19 (602, 623, and 631), and ankyrin repeat 20 (635 and 662) in AnkD34. The spectra in gray solid lines were recorded in the absence of wt-cdb3. The superimposed spectra in black dashed lines were recorded after complex formation with wt-cdb3. 25G, 25 Gauss.
FIGURE 7.
FIGURE 7.
Changes in spin label side chain mobility (upper panel) and solvent accessibility as assessed by collision frequency with NiEDDA (lower panel) mapped onto the x-ray crystal structure of AnkD34. The red residues in the top panel showed a decrease in side chain mobility upon complex formation, the black residues showed no change, and the blue residues showed significantly impaired complex formation when the wt residue was changed to cysteine and spin-labeled with MTSSL. The same color scheme is used for the NiEDDA accessibility data in the lower panel for the black and blue residues, whereas the residues that showed changes in accessibility were displayed with three different colors based on their ΔΠ (ΠcomplexAnkD34) values (red, ΔΠ < −14.0; hot pink, −14.0 ≤ ΔΠ < −5.0; pale pink, −5.0 ≤ ΔΠ < −2.0).
FIGURE 8.
FIGURE 8.
The 20 inter-protein distances between selected sites on cdb3 and on AnkD34 that were used to refine the structural model for the complex shown in Fig. 10. The distances measured by DEER are shown superimposed on a selected model for the complex in the upper panel. Representative DEER data (dots) and the fits to these data (solid red lines) from three of the label pairs are shown in the lower panel. In the lower panel, the insets show the average distances and distance distributions that were recovered from fitting the experimental data as described under “Experimental Procedures.” The data and analyses from the remaining 17 pairs are shown in supplemental Fig. S4, and the data from all pairs are summarized in Table 3.
FIGURE 9.
FIGURE 9.
Ensemble of structural models for the cdb3-AnkD34 complex superimposed on the crystal structure of AnkD34. The top panel shows 500 representative poses from the 100,000 generated by RosettaDock using no constraints to guide how the proteins could interact. The center panel shows how filtering these 100,000 poses using the 20 inter-protein distance constraints from DEER measurements reduced the number of poses to 811 and gave a strong indication of the surfaces of the two proteins that formed the binding interface, the potential orientations of cdb3 relative to AnkD34, and which ankyrin repeats were likely involved in binding. The bottom panel shows the top 30 structures that were obtained by filtering the 811 poses in the center panel with the solvent accessibility data as described under “Experimental Procedures.”
FIGURE 10.
FIGURE 10.
Color representation for the complex formed between cdb3 and AnkD34. In the upper panel, the α-carbon trace of AnkD34 (orange) has been held constant, and the 30 poses of the cdb3 dimer (green/blue) are positioned relative to AnkD34. In the lower panel, the pose of cdb3 that is closest to the mean of the 30 poses in the upper panel is shown docked with AnkD34. The view in the lower panel is rotated ∼90° from that shown in the upper panel to clearly see the positions of residues 160 and 254 on cdb3 and residues 598 and 631 on AnkD34, shown as silver balls at the binding interface. These residues showed high efficiency cross-linking with BMOE, as shown in Fig. 11. Also shown as blue balls are residues 133, 151, and 181 on cdb3 and residues 590, 623, and 656 on AnkD34. These residues showed exchange and dipolar couplings upon complex formation, as shown in Fig. 12. The β6-β7 hairpin loop is shown in red. Ankyrin repeats 13–16 and 23–24 have been cropped in the lower panel to allow expansion of repeats 18–20 at the binding interface.
FIGURE 11.
FIGURE 11.
Chemical cross-linking of cysteine residues at single sites on cdb3 and at single sites on AnkD34. The models in Fig. 10 predict residues that are at the protein-protein interface of the complex. These predictions were tested using the short cross-linking reagent BMOE. The SDS-PAGE results confirm that residues 160 and 254 on cbd3 are in close proximity to residues 598 and 631 on AnkD34. However, residues 160 and 254 on cdb3 do not form cross-links with residue 613 in the linker region of AnkD34 or with residues 616, 619, or 623 on the back convex surface.
FIGURE 12.
FIGURE 12.
Exchange and dipolar coupling between spin-labeled sites on cdb3 and on AnkD34 that are predicted from the models in Fig. 10 to be at the binding interface. EPR spectra from the complexes (dashed lines) were superimposed on the sum of single spectra (solid lines) after baseline correction and normalization of the spectra. 50 G, 50 Gauss.

Similar articles

Cited by

References

    1. Delaunay J. (2002) Acta Haematol. 108, 210–218 - PubMed
    1. Bennett V., Baines A. J. (2001) Physiol. Rev. 81, 1353–1392 - PubMed
    1. Nilsson K. R., Jr., Bennett V. (2009) J. Cardiovasc. Pharmacol. 54, 106–115 - PubMed
    1. Cunha S. R., Mohler P. J. (2011) Semin. Cell Dev. Biol. 22, 166–170 - PMC - PubMed
    1. Michaely P., Tomchick D. R., Machius M., Anderson R. G. (2002) EMBO J. 21, 6387–6396 - PMC - PubMed

Publication types

MeSH terms

LinkOut - more resources