. 2011 Jun 17;286(24):21717-31.
doi: 10.1074/jbc.M110.194597. Epub 2011 Apr 14.

Peracetylated 4-fluoro-glucosamine reduces the content and repertoire of N- and O-glycans without direct incorporation

Affiliations

Peracetylated 4-fluoro-glucosamine reduces the content and repertoire of N- and O-glycans without direct incorporation

Steven R Barthel et al. J Biol Chem. .

Abstract

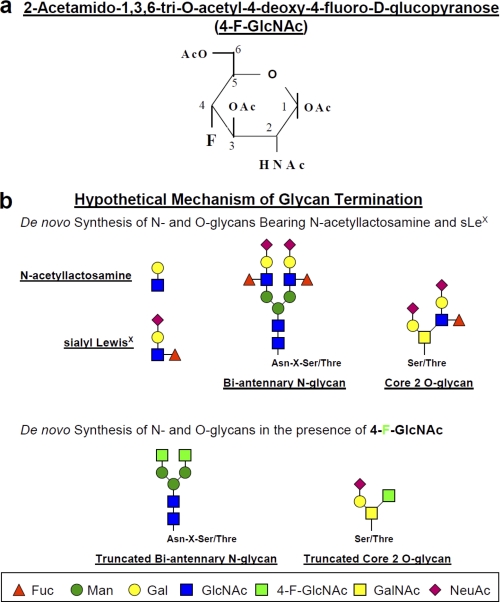
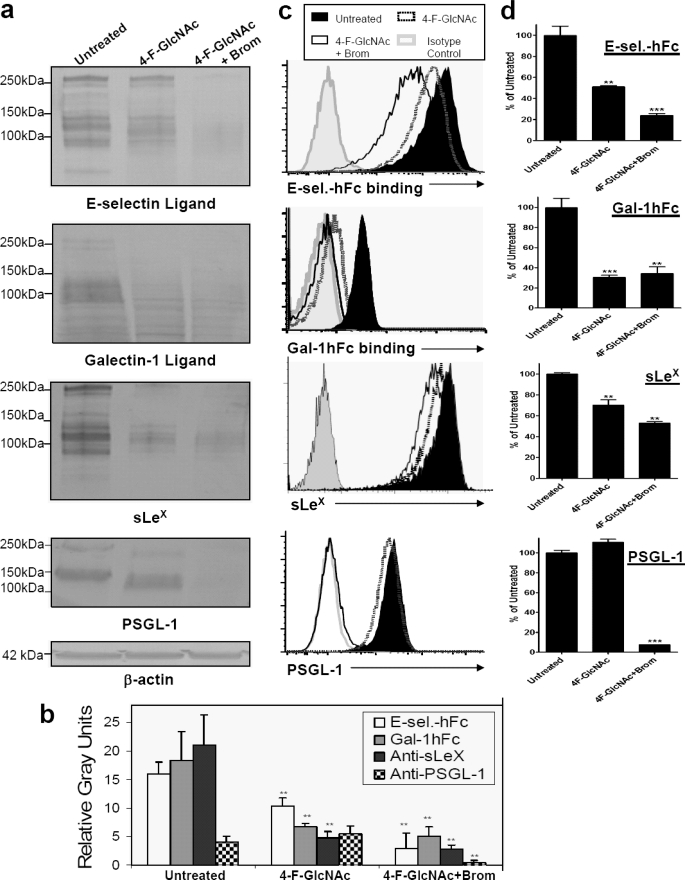
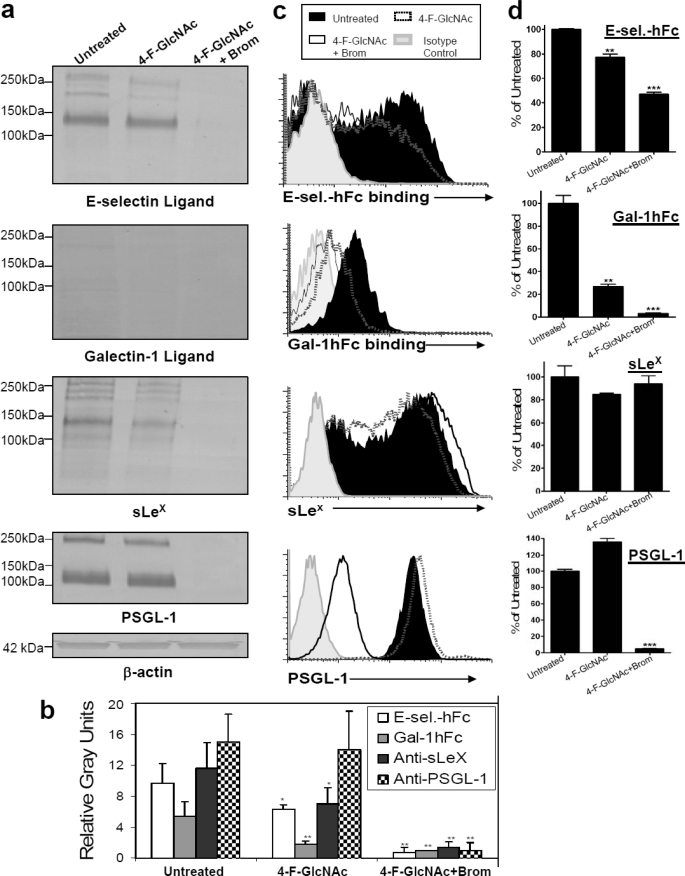
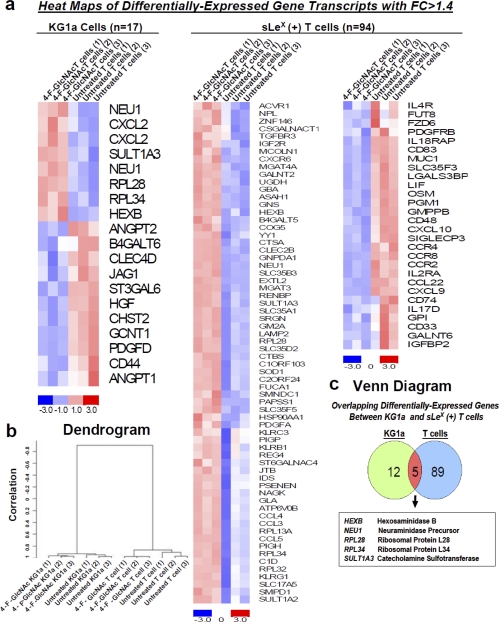
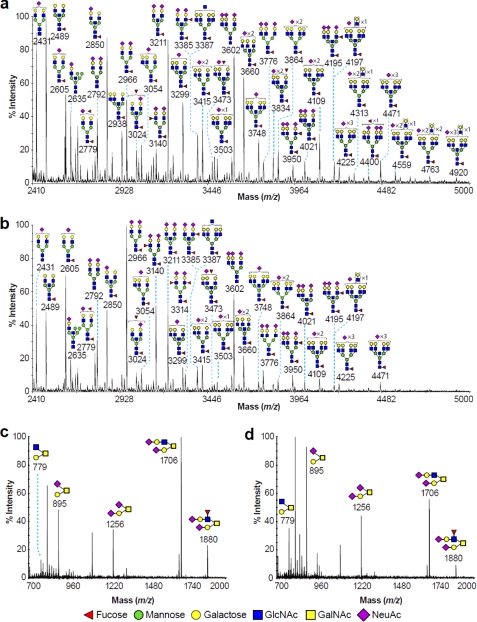
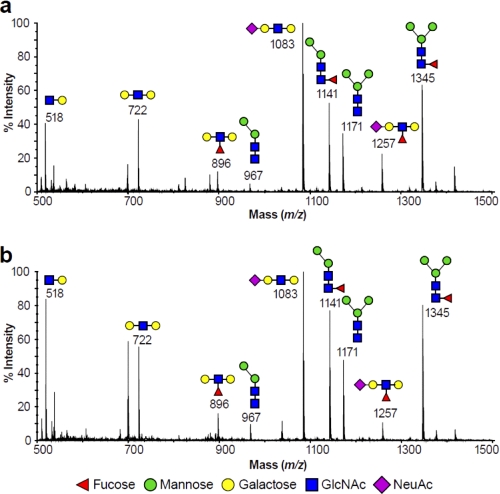
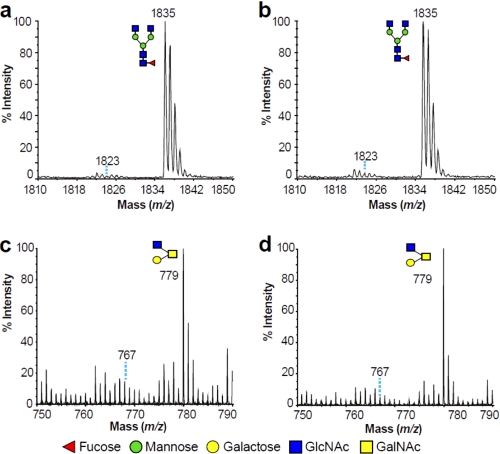
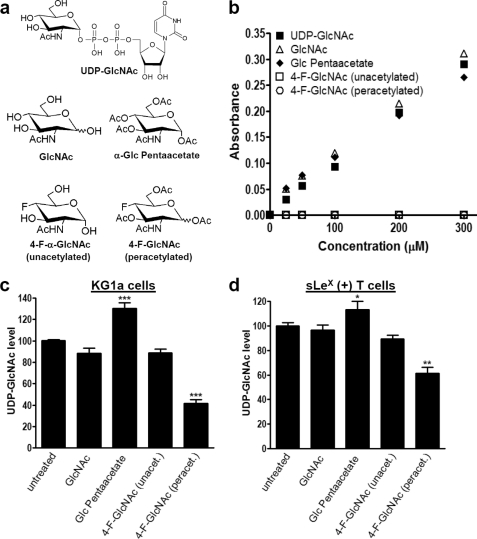
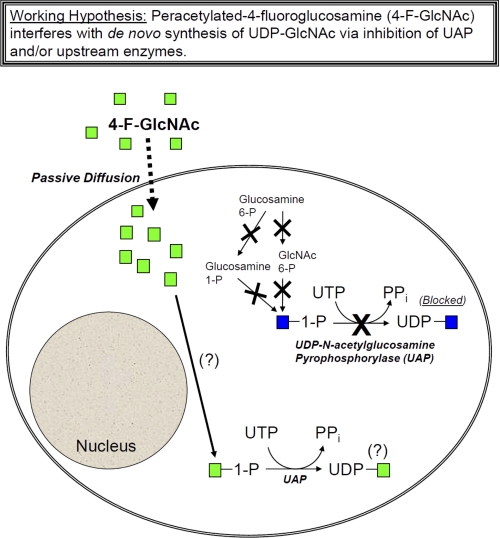
Prior studies have shown that treatment with the peracetylated 4-fluorinated analog of glucosamine (4-F-GlcNAc) elicits anti-skin inflammatory activity by ablating N-acetyllactosamine (LacNAc), sialyl Lewis X (sLe(X)), and related lectin ligands on effector leukocytes. Based on anti-sLe(X) antibody and lectin probing experiments on 4-F-GlcNAc-treated leukocytes, it was hypothesized that 4-F-GlcNAc inhibited sLe(X) formation by incorporating into LacNAc and blocking the addition of galactose or fucose at the carbon 4-position of 4-F-GlcNAc. To test this hypothesis, we determined whether 4-F-GlcNAc is directly incorporated into N- and O-glycans released from 4-F-GlcNAc-treated human sLe(X) (+) T cells and leukemic KG1a cells. At concentrations that abrogated galectin-1 (Gal-1) ligand and E-selectin ligand expression and related LacNAc and sLe(X) structures, MALDI-TOF and MALDI-TOF/TOF mass spectrometry analyses showed that 4-F-GlcNAc 1) reduced content and structural diversity of tri- and tetra-antennary N-glycans and of O-glycans, 2) increased biantennary N-glycans, and 3) reduced LacNAc and sLe(X) on N-glycans and on core 2 O-glycans. Moreover, MALDI-TOF MS did not reveal any m/z ratios relating to the presence of fluorine atoms, indicating that 4-F-GlcNAc did not incorporate into glycans. Further analysis showed that 4-F-GlcNAc treatment had minimal effect on expression of 1200 glycome-related genes and did not alter the activity of LacNAc-synthesizing enzymes. However, 4-F-GlcNAc dramatically reduced intracellular levels of uridine diphosphate-N-acetylglucosamine (UDP-GlcNAc), a key precursor of LacNAc synthesis. These data show that Gal-1 and E-selectin ligand reduction by 4-F-GlcNAc is not caused by direct 4-F-GlcNAc glycan incorporation and consequent chain termination but rather by interference with UDP-GlcNAc synthesis.


Figures

FIGURE 1.
FIGURE 1.
a, structure of 4-F-GlcNAc; b, putative mechanism of anti-glycosylation action.
FIGURE 2.
FIGURE 2.
Analysis of 4-F-GlcNAc efficacy on E-selectin and Gal-1 ligand expression on sLeX KG1a cells. a, Western blots of KG1a cells treated with diluent control (Untreated), 0.05 mm 4-F-GlcNAc, or 4-F-GlcNAc and bromelain were stained with mouse E-selectin-human IgG Fc1 (E-sel.-hFc) (1 μg/ml), Gal-1hFc (10 μg/ml), anti-sLeX mAb (1 μg/ml), anti-PSGL-1 mAb (1 μg/ml), or anti-β-actin mAb (1 μg/ml). b, using NIH ImageJ, densitometric gray scale units of scanned lanes from 50 to 260 kDa of triplicate Western blots were measured and plotted as mean ± S.D. (error bars) in relative gray units. c, flow cytometry of KG1a cells treated with diluent control (Untreated), 0.05 mm 4-F-GlcNAc, or 4-F-GlcNAc and bromelain were stained with mouse E-selectin-human IgG Fc1 (1 μg/ml), Gal-1hFc (10 μg/ml), anti-sLeX mAb (1 μg/ml), anti-PSGL-1 mAb (1 μg/ml), or respective isotype control and respective fluorophore-conjugated secondary antibody. d, mean fluorescent intensities from triplicate flow cytometry experiments were compared with untreated control and presented as percentage of untreated control. Statistically significant differences when compared with untreated controls are shown as follows. **, p < 0.01; ***, p < 0.001.
FIGURE 3.
FIGURE 3.
Analysis of 4-F-GlcNAc efficacy on E-selectin and Gal-1 ligand expression on sLeX (+) T cells. a, Western blots of T cells treated with diluent control (Untreated), 0.05 mm 4-F-GlcNAc, or 4-F-GlcNAc and bromelain were stained with mouse E-selectin-human IgG Fc1 (E-sel.-hFc) (1 μg/ml), Gal-1hFc (10 μg/ml), anti-sLeX mAb (1 μg/ml), anti-PSGL-1 mAb (1 μg/ml), or anti-β-actin mAb (1 μg/ml). b, using NIH ImageJ, densitometric gray scale units of scanned lanes from 50 to 260 kDa of triplicate Western blots were measured and plotted as mean ± S.D. (error bars) in relative gray units. c, flow cytometry of T cells treated with diluent control, 0.05 mm 4-F-GlcNAc, or 4-F-GlcNAc and bromelain were stained with mouse E-selectin-human IgG Fc1 (1 μg/ml), Gal-1hFc (10 μg/ml), anti-sLeX mAb (1 μg/ml), anti-PSGL-1 mAb (1 μg/ml), or the respective isotype control and respective fluorophore-conjugated secondary antibody. d, mean fluorescent intensities from triplicate flow cytometry experiments were compared with untreated control and presented as percentage of untreated control. Statistically significant differences when compared with untreated controls are shown as follows. *, p < 0.05; **, p < 0.01; ***, p < 0.001.
FIGURE 4.
FIGURE 4.
Gene expression analysis of 4-F-GlcNAc-treated sLeX (+) KG1a and T cells. a, heat maps of differentially expressed gene transcripts from untreated versus 4-F-GlcNAc-treated KG1a cells and untreated versus 4-F-GlcNAc-treated T cells depict increased (red) and decreased (blue) expression relative to the mean transcript expression values. At FC of 4-F-GlcNAc-treated/untreated ratios greater than 1.4, there were 17 and 94 differentially expressed gene transcripts from KG1a and T cells, respectively (adjusted p value of <0.1). b, gene expression clustering from untreated and 4-F-GlcNAc-treated KG1a and T cells of triplicate experiments was validated using centered correlation and average linkage and is represented in a dendrogram. c, a Venn diagram demonstrated that five genes were similarly modulated in KG1a and T cells (adjusted p value of <0.15).
FIGURE 5.
FIGURE 5.
Partial MALDI-TOF spectra of permethylated N- and O-glycans derived from untreated and 4-F-GlcNAc-treated KG1a cells. Shown is the N-glycomic profile of untreated (a) and 4-F-GlcNAc-treated KG1a cells (b) and the O-glycomic profile of untreated (c) and 4-F-GlcNAc-treated KG1a cells (d). N- and O-glycomic profiles were obtained from the 50% MeCN fraction from a C18 Sep-Pak column (see “Experimental Procedures”). For clarity, major ions are shown. Schematic structures are according to the Consortium for Functional Glycomics guidelines. All molecular ions are [M + Na]+. Putative structures are based on composition, tandem MS, and biosynthetic knowledge. Structures that show sugars outside a bracket have not been unequivocally defined.
FIGURE 6.
FIGURE 6.
Low mass MALDI-TOF mass spectra of permethylated N-glycans from endo-β-galactosidase digestion of KG1a cells. Profile of N-glycans of untreated (a) and 4-F-GlcNAc-treated KG1a cells (b). Profiles are from the 35% MeCN fraction from a C18 Sep-Pak column (see “Experimental Procedures”). All molecular ions are [M + Na]+. Putative structures based on composition, tandem MS, and the literature are shown. Schematic structures are according to the Consortium for Functional Glycomics guidelines.
FIGURE 7.
FIGURE 7.
Partial MALDI-TOF spectra of permethylated N- and O-glycans derived from untreated and 4-F-GlcNAc-treated KG1a cells. Shown are enlarged scans of signals present at m/z 1835 (N-glycans) and 779 (O-glycans). N-glycomic profiles were obtained from the 35% MeCN fraction, whereas O-glycomic profiles were obtained from the 50% MeCN fraction (Fig. 5), both from a C18 Sep-Pak column (see “Experimental Procedures”). All molecular ions are [M + Na]+. Putative structures based on composition, tandem MS, and the literature are shown. Schematic structures are according to the Consortium for Functional Glycomics guidelines. Signals at m/z 1823 in a and b and at m/z 767 in c and d correspond to the theoretical incorporation of 4-F-GlcNAc.
FIGURE 8.
FIGURE 8.
Measurement of UDP-GlcNAc level in extracts of 4-F-GlcNAc-treated sLeX (+) KG1a and T cells. a, chair configurations of 4-F-GlcNAc (peracetylated) and structurally related control analogs, UDP-GlcNAc, GlcNAc, α-Glc pentaacetate, and 4-F-α-GlcNAc (unacetylated). b, assay specificity for detecting the sugars shown in a. c and d, level of UDP-GlcNAc measured in sLeX (+) KG1a or T cell extracts. KG1a cells were incubated for 48 h with 0.05 mm sugars. T cells were incubated for 48 h with 0.05 mm sugars or for 38 h with 0.01–0.025 mm 4-F-GlcNAc (peracetylated). Shown is mean UDP-GlcNAc level with S.E. indicated when compared with untreated control. Experiments were performed in triplicate on at least three separate occasions and donors. Statistically significant differences compared with untreated controls are shown as follows. *, p < 0.05; **, p < 0.01; ***, p < 0.001, one-way analysis of variance with Dunnett's post hoc test.
FIGURE 9.
FIGURE 9.
Working hypothesis for 4-F-GlcNAc-mediated lowering of UDP-GlcNAc in cells. As shown in the illustration, UDP-GlcNAc is synthesized from upstream glycan precursors, including GlcNAc 1-phosphate (blue), glucosamine 6-phosphate (Glucosamine 6-P), glucosamine 1-phosphate (Glucosamine 1-P), and GlcNAc 6-phosphate. 4-F-GlcNAc (peracetylated) can passively diffuse into the cell aided by acetyl groups, wherein it subsequently inhibits UDP-GlcNAc formation via a mechanism that is still unknown. Shown are possible steps that might be inhibited by 4-F-GlcNAc that include UDP-N-acetylglucosamine pyrophosphorylase (UAP) along with upstream enzymatic steps involved in the generation of GlcNAc 1-phosphate. As emphasized with question marks, it is also unclear whether, upon entry into the cell, 4-F-GlcNAc is converted to 4-F-GlcNAc 1-phosphate and/or whether UAP can convert this potential intermediate into UDP-4-F-GlcNAc. Because 4-F-GlcNAc could not be detected by the cellular UDP-GlcNAc assay, formation of a UDP-4-F-GlcNAc intermediate is still unknown.

Similar articles

Cited by

References

    1. Liu F. T., Rabinovich G. A. (2010) Ann. N.Y. Acad. Sci. 1183, 158–182 - PubMed
    1. Rabinovich G. A., Ilarregui J. M. (2009) Immunol. Rev. 230, 144–159 - PubMed
    1. Rabinovich G. A., Toscano M. A. (2009) Nat. Rev. Immunol. 9, 338–352 - PubMed
    1. Salatino M., Croci D. O., Bianco G. A., Ilarregui J. M., Toscano M. A., Rabinovich G. A. (2008) Expert Opin. Biol. Ther. 8, 45–57 - PubMed
    1. Ley K., Kansas G. S. (2004) Nat. Rev. Immunol. 4, 325–335 - PubMed

Publication types