. 2011 May;22(5):839-48.
doi: 10.1681/ASN.2010050526. Epub 2011 Apr 14.

Loss of primary cilia upregulates renal hypertrophic signaling and promotes cystogenesis

Affiliations

Loss of primary cilia upregulates renal hypertrophic signaling and promotes cystogenesis

P Darwin Bell et al. J Am Soc Nephrol. 2011 May.

Abstract

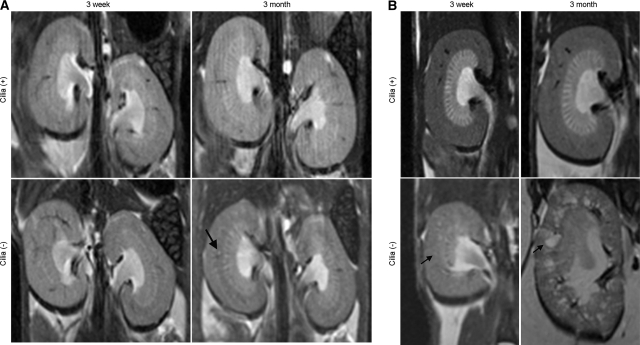
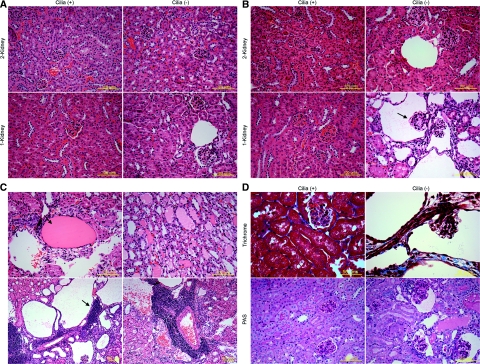
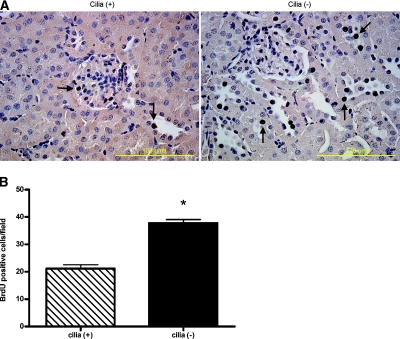
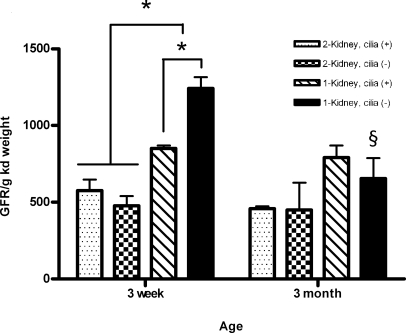
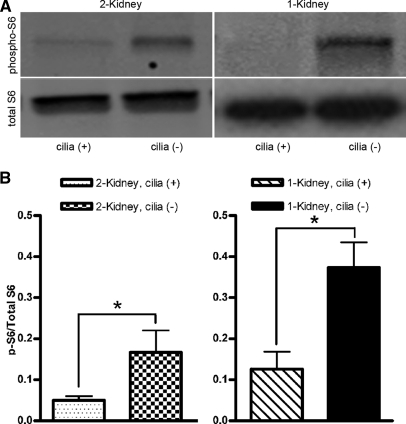
Primary cilia dysfunction alters renal tubular cell proliferation and differentiation and associates with accelerated cyst formation in polycystic kidney disease. However, the mechanism leading from primary ciliary dysfunction to renal cyst formation is unknown. We hypothesize that primary cilia prevent renal cyst formation by suppressing pathologic tubular cell hypertrophy and proliferation. Unilateral nephrectomy initiates tubular cell hypertrophy and proliferation in the contralateral kidney and provides a tool to examine primary cilia regulation of renal hypertrophy. Conditional knockout of the primary cilia ift88 gene leads to delayed, adult-onset renal cystic disease, which provides a window of opportunity to conduct unilateral nephrectomy and examine downstream kinetics of renal hypertrophy and cyst formation. In wild-type animals, unilateral nephrectomy activated the mTOR pathway and produced appropriate structural and functional hypertrophy without renal cyst formation. However, in ift88 conditional knockout animals, unilateral nephrectomy triggered increased renal hypertrophy and accelerated renal cyst formation, leading to renal dysfunction. mTOR signaling also increased compared with wild-type animals, suggesting a mechanistic cascade starting with primary ciliary dysfunction, leading to excessive mTOR signaling and renal hypertrophic signaling and culminating in cyst formation. These data suggest that events initiating hypertrophic signaling, such as structural or functional loss of renal mass, may accelerate progression of adult polycystic kidney disease toward end-stage renal disease.


Figures

Figure 1.
Figure 1.
Accelerated cystogenesis at 3 months in a one kidney cilia (−) mouse. MRI was performed in anesthetized, living mice with respiratory gating: (a) 2-K mice and (b) 1-K mice. Within each panel, images to the left are mice at 3 weeks and to the right are from the same mice imaged at 3 months. Arrows denote the presence of a cyst. Images shown are representative mice from the following groups: (a) n = 4, cilia (+); n = 4, cilia (−) and (b) n = 4, cilia (+); n = 5, cilia (−).
Figure 2.
Figure 2.
Glomerular and tubular cysts and immune infiltrates in the one kidney cilia (−) mouse at 3 months. H&E sections (5 μm) from (A) 3-week and (B) 3-month mice. Photomicrographs are representative mouse sections from the following groups: (A) 3 weeks, n = 4, 2-K cilia (+); n = 5, 2-K cilia (−); n = 6, 1-K cilia (+); n = 7, 1-K cilia (−) and (B) 3 months, n = 5, 2-K cilia (+); n = 5, 2-K cilia (−); n = 4, 1-K cilia (+); and n = 4, 1-K cilia (−). Magnification for all panels is 20×. Occasional small cysts are seen in 3-week 1-K cilia (−) and 3-month 2-K cilia (−) mice. Photomicrograph in panel B, lower right, shows massive cysts with the arrow indicating a glomerular cyst. The upper pair of images in panel C represents 5-μm H&E stained sections from 3-month 1-K cilia (−) mice. Arrow in the upper left image denotes the presence of a cortical cyst containing eosinophilic proteinaceous material. This same material is located in cystic structures in collecting ducts from the medulla (upper right image). Both images are at 20×. The lower pair of images in panel C shows examples of intense inflammatory infiltrates associated with cysts (left side) and cuffing vascular structures (right side). Arrow denotes an area of lymphocyte infiltrate. Lower images are at 10×. Panel d is representative 5-μm sections stained with Masson trichrome, 40×, or PAS, 20×, from 3-month 1-K cilia (+) and cilia (−) mice.
Figure 3.
Figure 3.
Cysts originate from collecting ducts and not in proximal tubules. Images from a 1-K 3-month cilia (−) mouse. (A) Left-side upper and lower panels are FITC-DBA staining for collecting ducts, the middle panels are differential interference contrast microscopy images, and the right-side panels are an overlay of the two images. (B) Similar arrangement of images but using FITC-LTL, which is a marker for proximal tubules. Nuclei are stained with Hoechst.
Figure 4.
Figure 4.
Cell proliferation is enhanced in the one kidney cilia (−) kidney. BrdU-stained kidney sections from (A) 3-week 1-K cilia (+) and 3-week 1-K cilia (−) mice. Panel B is a summary of the number of BrdU-positive cells per field; there were three mice in each group. Slides were analyzed in a random order and one observer (K.S.) blinded to group counted BrdU-positive cells. *P < 0.05, two-tailed t test, three mice per group, one slide per mouse, ten fields per slide at 40× magnification.
Figure 5.
Figure 5.
Structural hypertrophy is enhanced in the absence of cilia. (A) Difference (Δ) in kidney volume as determined by MRI at 3 months versus 3 weeks for each of the four groups. In the 2-K groups, kidney volume is only for the left kidney so that it can be directly compared with the 1-K groups. * P < 0.05, one-way ANOVA, between 3 months and 3 weeks. The number of mice for each group was the same as indicated in Figure 1 for the MRI studies. Hypertrophic responses in (B) glomeruli diameter, (C) height of the proximal tubular epithelial cells, and (D) collecting duct cell height. Each panel is the difference (Δ) between the results obtained at 3 months and those obtained at 3 weeks. There were three mice in each of the eight groups. Two H&E slides were examined per mouse with ten individual measurements of glomerular diameter, proximal tubular epithelial cell height, and collecting duct cell height obtained per slide. Therefore, each average was the mean of 60 measurements from three animals. The same individual (P.D.B.) blinded to group obtained all measurements. *P < 0.05, one-way ANOVA, between 3 months and 3 weeks; **P < 0.05 between groups.
Figure 6.
Figure 6.
GFR increases in one kidney cilia (−) mouse at 3 weeks. GFR measurements obtained in 1-K and 2-K cilia (+) and cilia (−) at 3 weeks and 3 months. In the 3-week mouse groups, there were five mice in each of the four groups. In the 3-month mouse groups, there were three 2-K cilia (+), two 2-K cilia (−), five 1-K cilia (+), and five 1-K cilia (−) mice. *P < 0.05, §P < 0.05 one-way ANOVA between 3 weeks and 3 months.
Figure 7.
Figure 7.
Renal mTOR signaling is activated with cilia removal in 3-week mice. (A) Representative Western blots from 3-week 2-K cilia (+) and cilia (−) mice and (run on a separate Western blot) 3-week 1-K cilia (+) and cilia (−) mice. (B) Ratio of phospho-S6 over total S6 in all four groups as determined by densitometry analysis. Because 1-K and 2-K groups were run on separate blots, it was not possible to directly compare the 1-K and 2-K groups. *P < 0.05, two-tailed t test.

Comment in

  • Third-hit signaling in renal cyst formation.
    Weimbs T. Weimbs T. J Am Soc Nephrol. 2011 May;22(5):793-5. doi: 10.1681/ASN.2011030284. Epub 2011 Apr 14. J Am Soc Nephrol. 2011. PMID: 21493772 Free PMC article. No abstract available.

Similar articles

Cited by

References

    1. Guay-Woodford LM: Murine models of polycystic kidney disease: Molecular and therapeutic insights. Am J Physiol Renal Physiol 285: F1034–F1049, 2003 - PubMed
    1. Siroky BJ, Guay-Woodford LM: Renal cystic disease: The role of the primary cilium/centrosome complex in pathogenesis. Adv Chronic Kidney Dis 13: 131–137, 2006 - PubMed
    1. Zhou J: Polycystins and primary cilia: Primers for cell cycle progression. Annu Rev Physiol 71: 83–113, 2009 - PubMed
    1. Torres VE, Harris PC: Autosomal dominant polycystic kidney disease: The last 3 years. Kidney Int 76: 149–168, 2009 - PMC - PubMed
    1. Cardenas-Rodriguez M, Badano JL: Ciliary biology: Understanding the cellular and genetic basis of human ciliopathies. Am J Med Genet C Semin Med Genet 151: 263–280, 2009 - PubMed

Publication types

Substances