

Collaborative Cross mice and their power to map host susceptibility to Aspergillus fumigatus infection
- PMID: 21493779
- PMCID: PMC3149491
- DOI: 10.1101/gr.118786.110
Collaborative Cross mice and their power to map host susceptibility to Aspergillus fumigatus infection
Abstract
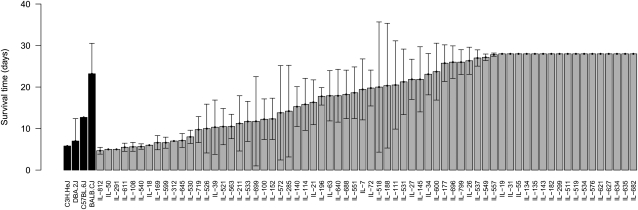
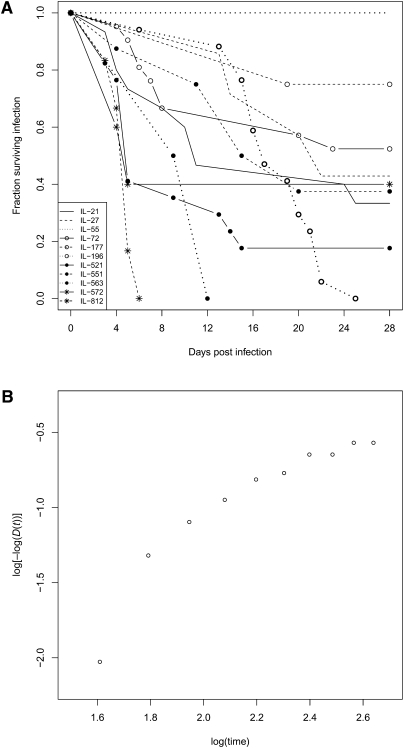
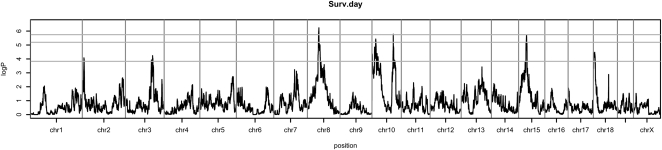
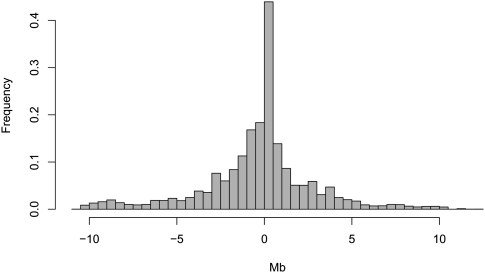
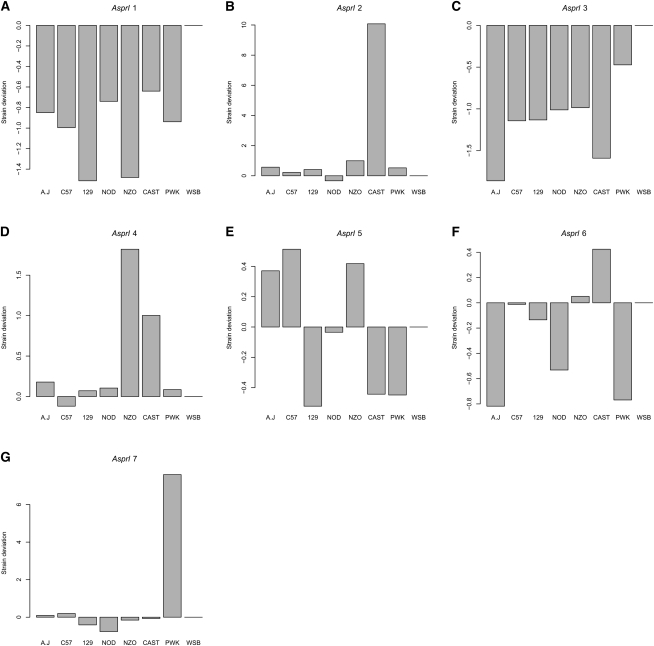
The Collaborative Cross (CC) is a genetic reference panel of recombinant inbred lines of mice, designed for the dissection of complex traits and gene networks. Each line is independently descended from eight genetically diverse founder strains such that the genomes of the CC lines, once fully inbred, are fine-grained homozygous mosaics of the founder haplotypes. We present an analysis of 120 CC lines, from a cohort of the CC bred at Tel Aviv University in collaboration with the University of Oxford, which at the time of this study were between the sixth and 12th generations of inbreeding and substantially homozygous at 170,000 SNPs. We show how CC genomes decompose into mosaics, and we identify loci that carry a deficiency or excess of a founder, many being deficient for the wild-derived strains WSB/EiJ and PWK/PhJ. We phenotyped 371 mice from 66 CC lines for a susceptibility to Aspergillus fumigatus infection. The survival time after infection varied significantly between CC lines. Quantitative trait locus (QTL) mapping identified genome-wide significant QTLs on chromosomes 2, 3, 8, 10 (two QTLs), 15, and 18. Simulations show that QTL mapping resolution (the median distance between the QTL peak and true location) varied between 0.47 and 1.18 Mb. Most of the QTLs involved contrasts between wild-derived founder strains and therefore would not segregate between classical inbred strains. Use of variation data from the genomes of the CC founder strains refined these QTLs further and suggested several candidate genes. These results support the use of the CC for dissecting complex traits.
Figures
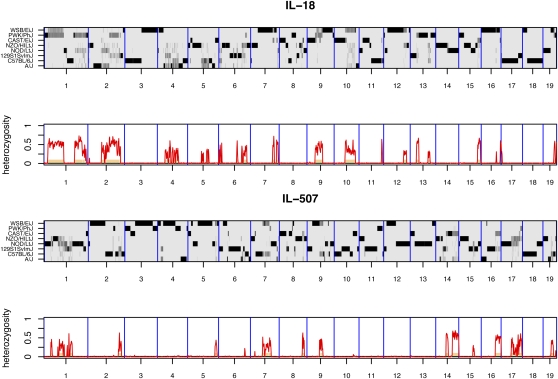
 for the haplotype of the CC founder s.
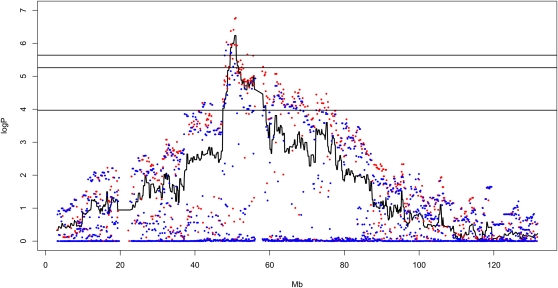
Similar articles
-
The Collaborative Cross mouse model for dissecting genetic susceptibility to infectious diseases.Mamm Genome. 2018 Aug;29(7-8):471-487. doi: 10.1007/s00335-018-9768-1. Epub 2018 Aug 24. Mamm Genome. 2018. PMID: 30143822 Review.
-
Genomes of the Mouse Collaborative Cross.Genetics. 2017 Jun;206(2):537-556. doi: 10.1534/genetics.116.198838. Genetics. 2017. PMID: 28592495 Free PMC article.
-
Male Infertility Is Responsible for Nearly Half of the Extinction Observed in the Mouse Collaborative Cross.Genetics. 2017 Jun;206(2):557-572. doi: 10.1534/genetics.116.199596. Genetics. 2017. PMID: 28592496 Free PMC article.
-
Identifying genetic susceptibility to Aspergillus fumigatus infection using collaborative cross mice and RNA-Seq approach.Animal Model Exp Med. 2024 Feb;7(1):36-47. doi: 10.1002/ame2.12386. Epub 2024 Feb 14. Animal Model Exp Med. 2024. PMID: 38356021 Free PMC article.
-
[The Collaborative Cross, a groundbreaking tool to tackle complex traits].Med Sci (Paris). 2012 Jan;28(1):103-8. doi: 10.1051/medsci/2012281024. Epub 2012 Jan 27. Med Sci (Paris). 2012. PMID: 22289838 Review. French.
Cited by
-
Genetic structure of phenotypic robustness in the collaborative cross mouse diallel panel.J Evol Biol. 2016 Sep;29(9):1737-51. doi: 10.1111/jeb.12906. Epub 2016 Jul 8. J Evol Biol. 2016. PMID: 27234063 Free PMC article.
-
Contrasting genetic architectures in different mouse reference populations used for studying complex traits.Genome Res. 2015 Jun;25(6):775-91. doi: 10.1101/gr.187450.114. Epub 2015 May 7. Genome Res. 2015. PMID: 25953951 Free PMC article. Review.
-
Ten years of the Collaborative Cross.Genetics. 2012 Feb;190(2):291-4. doi: 10.1534/genetics.111.138032. Genetics. 2012. PMID: 22345604 Free PMC article. No abstract available.
-
Efficient protocols and methods for high-throughput utilization of the Collaborative Cross mouse model for dissecting the genetic basis of complex traits.Animal Model Exp Med. 2019 Jul 10;2(3):137-149. doi: 10.1002/ame2.12074. eCollection 2019 Sep. Animal Model Exp Med. 2019. PMID: 31773089 Free PMC article. Review.
-
OvAd1, a Novel, Potent, and Selective Chimeric Oncolytic Virus Developed for Ovarian Cancer by 3D-Directed Evolution.Mol Ther Oncolytics. 2016 Dec 14;4:55-66. doi: 10.1016/j.omto.2016.12.001. eCollection 2017 Mar 17. Mol Ther Oncolytics. 2016. PMID: 28345024 Free PMC article.
References
-
- Beck JA, Lloyd S, Hafezparast M, Lennon-Pierce M, Eppig JT, Festing MF, Fisher EM 2000. Genealogies of mouse inbred strains. Nat Genet 24: 23–25 - PubMed
-
- Bowman JC, Abruzzo GK, Anderson JW, Flattery AM, Gill CJ, Pikounis VB, Schmatz DM, Liberator PA, Douglas CM 2001. Quantitative PCR assay to measure Aspergillus fumigatus burden in a murine model of disseminated aspergillosis: demonstration of efficacy of caspofungin acetate. Antimicrob Agents Chemother 45: 3474–3481 - PMC - PubMed
Publication types
MeSH terms
Grants and funding
LinkOut - more resources
Full Text Sources
Medical
Molecular Biology Databases
Miscellaneous