

Background parenchymal enhancement at breast MR imaging and breast cancer risk
- PMID: 21493794
- PMCID: PMC6939979
- DOI: 10.1148/radiol.11102156
Background parenchymal enhancement at breast MR imaging and breast cancer risk
Abstract
Purpose: To examine the relationships between breast cancer and both amount of fibroglandular tissue (FGT) and level of background parenchymal enhancement (BPE) at magnetic resonance (MR) imaging.
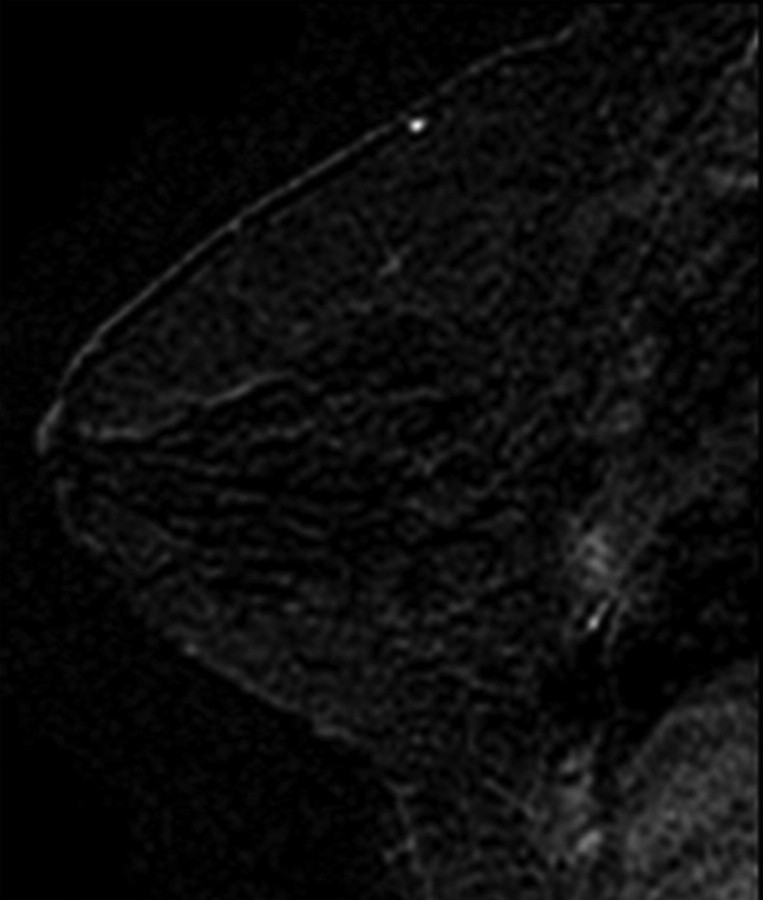
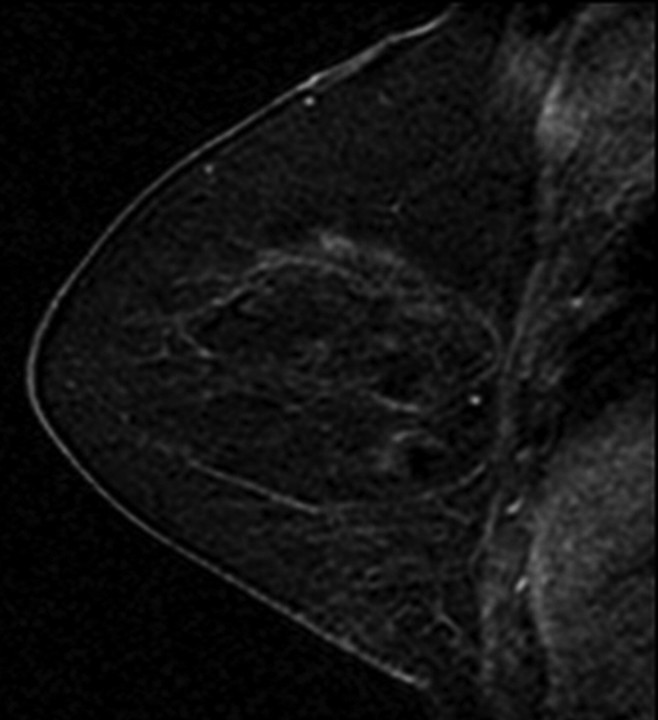
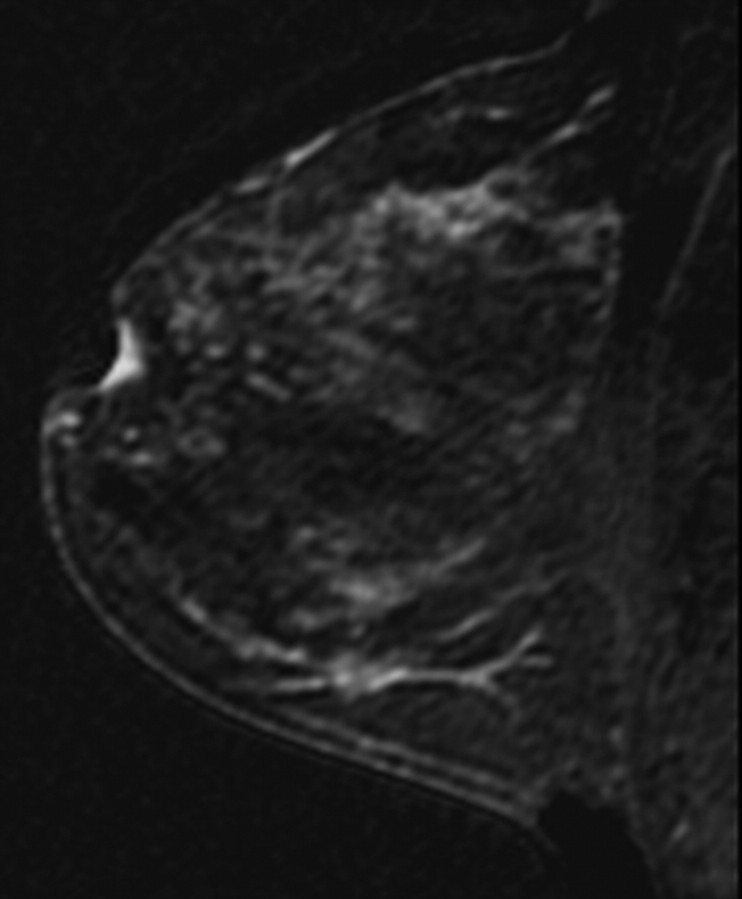
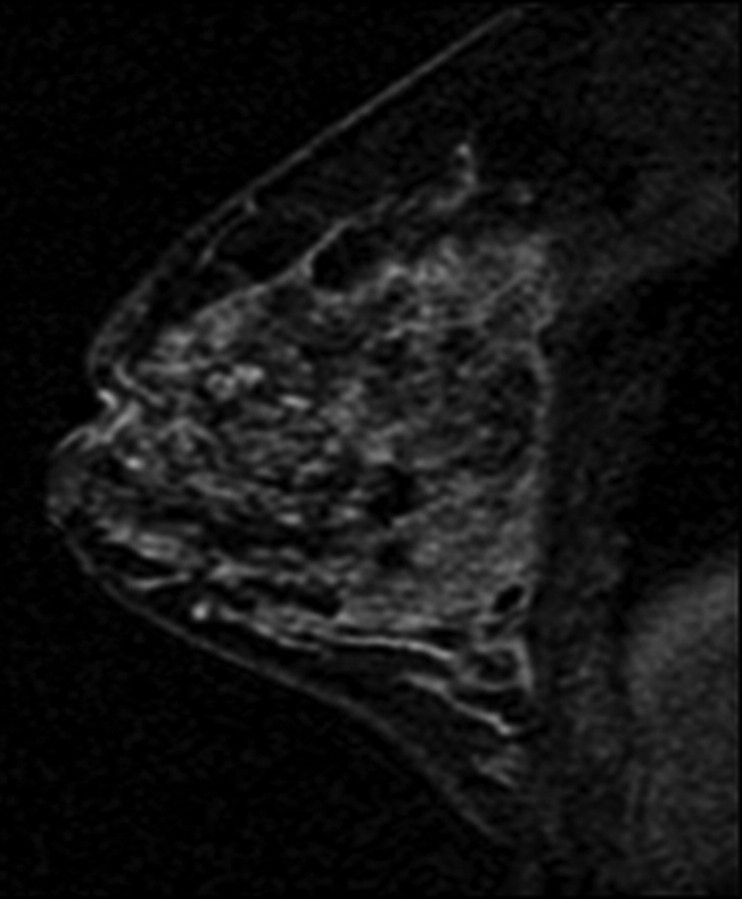
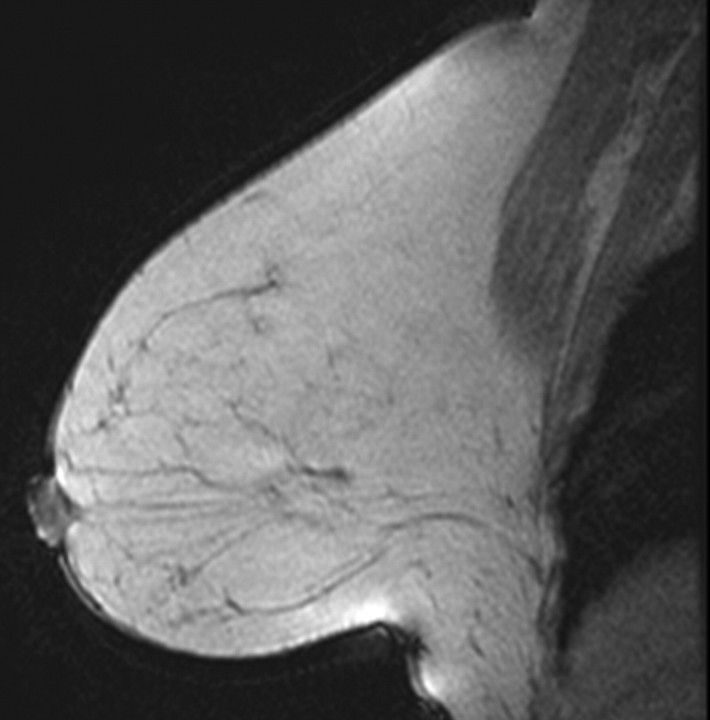
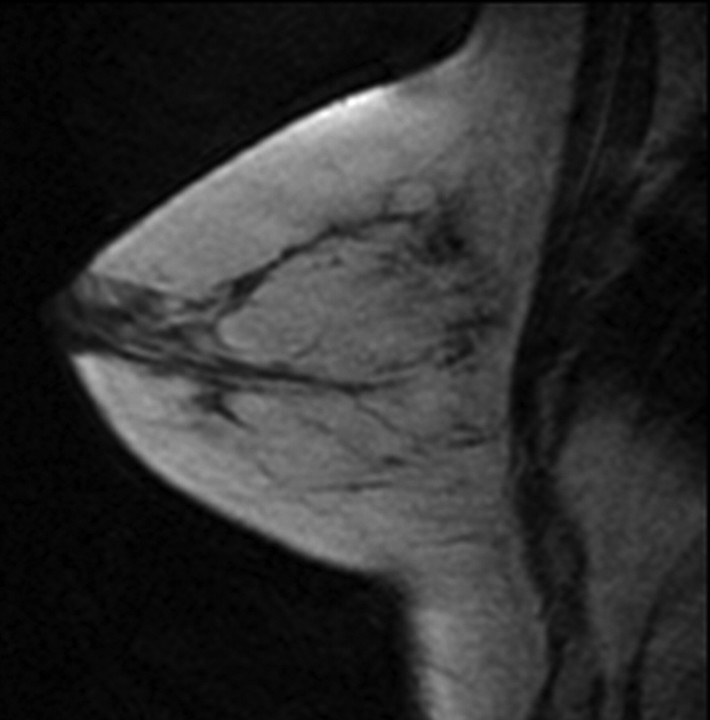
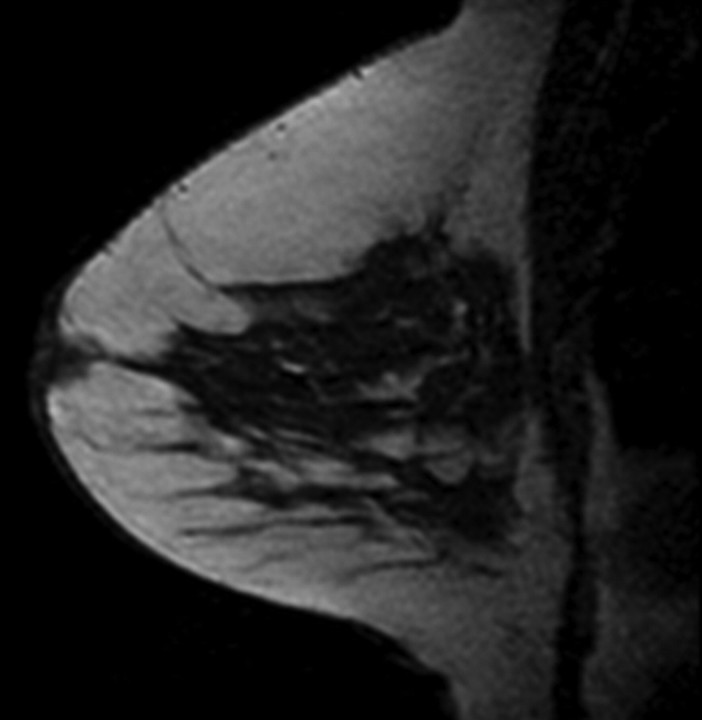
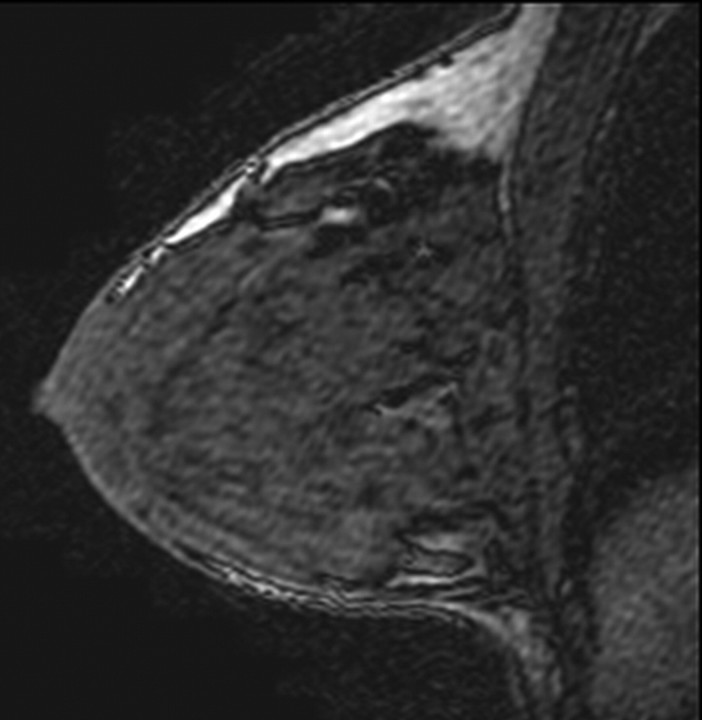
Materials and methods: A waiver of authorization was granted by the institutional review board for this retrospective HIPAA-compliant study. Among 1275 women who underwent breast MR imaging screening between December 2002 and February 2008, 39 breast carcinoma cases were identified. Two comparisons were performed: In one comparison, two normal controls--those of the women with negative (benign) findings at breast MR imaging--were matched to each breast cancer case on the basis of age and date of MR imaging. In the second comparison, one false-positive control--that of a woman with suspicious but nonmalignant findings at MR imaging--was similarly matched to each breast cancer case. Two readers independently rated the level of MR imaging-depicted BPE and the amount of MR imaging-depicted FGT by using a categorical scale: BPE was categorized as minimal, mild, moderate, or marked, and FGT was categorized as fatty, scattered, heterogeneously dense, or dense.
Results: Compared with the odds ratio (OR) for a normal control, the OR for breast cancer increased significantly with increasing BPE: The ORs for moderate or marked BPE versus minimal or mild BPE were 10.1 (95% confidence interval [CI]: 2.9, 35.3; P < .001) and 3.3 (95% CI: 1.3, 8.3; P = .006) for readers 1 and 2, respectively. Similar odds were seen when the false-positive controls were compared with the breast cancer cases: The ORs for moderate or marked BPE versus minimal or mild BPE were 5.1 (95% CI: 1.4, 19.1; P = .005) and 3.7 (95% CI: 1.2, 11.2; P = .013) for readers 1 and 2, respectively. The breast cancer odds also increased with increasing FGT, but the BPE findings remained significant after adjustment for FGT.
Conclusion: Increased BPE is strongly predictive of breast cancer odds.
Figures
References
-
- Wolfe JN. Risk for breast cancer development determined by mammographic parenchymal pattern. Cancer 1976;37(5):2486–2492. - PubMed
-
- Wolfe JN. Breast patterns as an index of risk for developing breast cancer. AJR Am J Roentgenol 1976;126(6):1130–1137. - PubMed
-
- Wolfe JN, Saftlas AF, Salane M. Mammographic parenchymal patterns and quantitative evaluation of mammographic densities: a case-control study. AJR Am J Roentgenol 1987;148(6):1087–1092. - PubMed
-
- van Gils CH, Hendriks JH, Holland R, et al. Changes in mammographic breast density and concomitant changes in breast cancer risk. Eur J Cancer Prev 1999;8(6):509–515. - PubMed
-
- Byrne C, Schairer C, Wolfe J, et al. Mammographic features and breast cancer risk: effects with time, age, and menopause status. J Natl Cancer Inst 1995;87(21):1622–1629. - PubMed
MeSH terms
Grants and funding
LinkOut - more resources
Full Text Sources
Medical
