

Review
doi: 10.1167/iovs.10-6312.
Print 2011 Apr.
Optical coherence tomography: history, current status, and laboratory work
Affiliations
- PMID: 21493951
- PMCID: PMC3088542
- DOI: 10.1167/iovs.10-6312
Item in Clipboard
Review
Optical coherence tomography: history, current status, and laboratory work
Invest Ophthalmol Vis Sci.
.
Abstract
Optical coherence tomography (OCT) imaging has become widespread in ophthalmology over the past 15 years, because of its ability to visualize ocular structures at high resolution. This article reviews the history of OCT imaging of the eye, its current status, and the laboratory work that is driving the future of the technology.
Figures
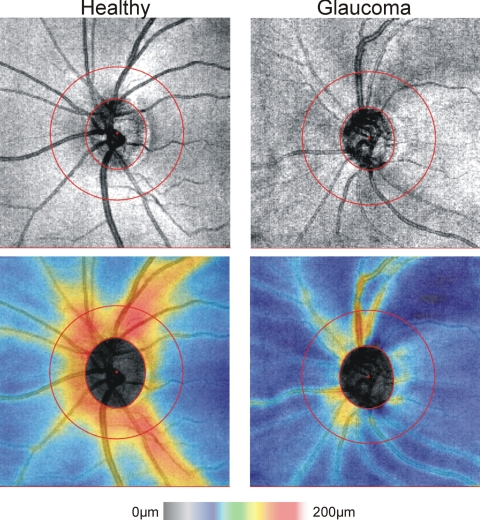
Top: OCT fundus images; bottom: RNFL thickness maps obtained by segmenting RNFL at all locations outside of the optic nerve, for a healthy and glaucoma subject. Outer red circle: the location of a resampled 3.4-mm peripapillary cross-section. Images acquired with Cirrus HD-OCT; 200 × 200 A-scans, 6 × 6 mm.
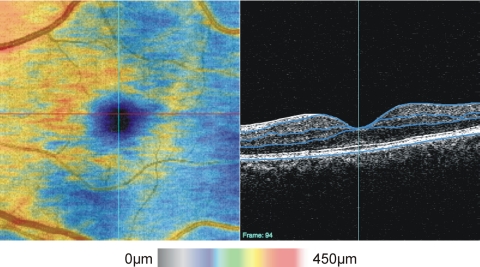
Left: SD-OCT macular thickness map (inner retinal complex); right: cross-sectional image showing automated segmentation results for one frame of the 3D volume. Image acquired with Cirrus HD-OCT; 200 × 200 A-scans, 6 × 6 mm); Blue lines: from inner to outer retina, indicate the outer border of the retinal nerve fiber layer, outer border of the inner plexiform layer, outer border of the outer plexiform layer and RPE.
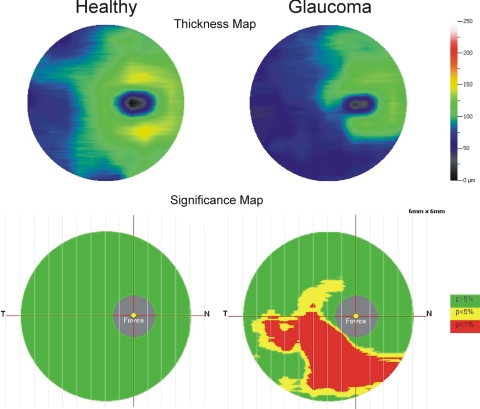
Ganglion cell complex thickness and significance maps for a healthy (left) and glaucoma (right) subject. The ganglion cell complex includes cell bodies, axons and dendrites of retinal ganglion cells. Images acquired with RTVue-100: 1 horizontal B-scan, and 15 vertical B-scans (separated by 0.5 mm). All B-scans consisted of 933 A-scans; 7 × 6 mm scan area.
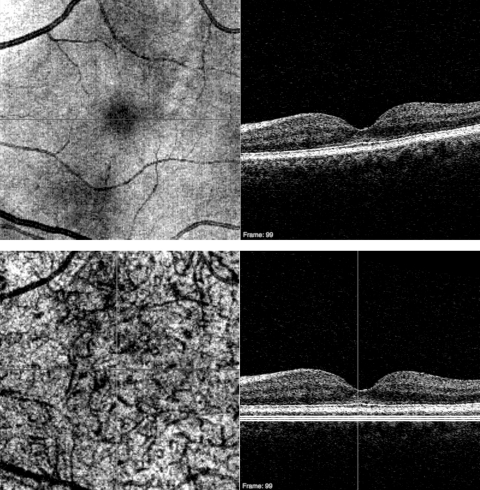
Top left: Macular SD-OCT fundus image; top right: cross-section through the fovea. Bottom left: C-mode of choroidal vessels; bottom right: based on a slab of thickness indicated by the three horizontal white lines after aligning to the RPE. Image acquired with Cirrus HD-OCT; 200 × 200 A-scans, 6 × 6 mm).
References
-
- Fercher AF, Mengedoht K, Werner W. Eye-length measurement by interferometry with partially coherent light. Opt Lett. 1988;13:186–188 - PubMed
-
- Fercher AF, Hitzenberger CK, Drexler W, Kamp G, Sattmann H. In vivo optical coherence tomography. Am J Ophthalmol. 1993;116:113–114 - PubMed
-
- Puliafito CA, Hee MR, Lin CP, et al. Imaging of macular diseases with optical coherence tomography. Ophthalmology. 1995;102:217–229 - PubMed
-
- Hee MR, Izatt JA, Swanson EA, et al. Optical coherence tomography of the human retina. Arch Ophthalmol. 1995;113:325–332 - PubMed
Publication types
MeSH terms
Grants and funding
LinkOut - more resources
Full Text Sources
Other Literature Sources
Medical
Miscellaneous
