

THE ROLE OF THE QUINONE POOL IN THE CYCLIC ELECTRON-TRANSFER CHAIN OF RHODOPSEUDOMONAS SPHAEROIDES: A MODIFIED Q-CYCLE MECHANISM
- PMID: 21494412
- PMCID: PMC3074349
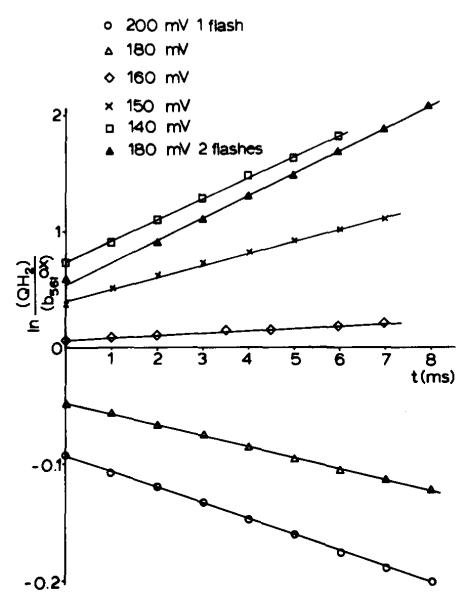
- DOI: 10.1016/0005-2728(83)90120-2
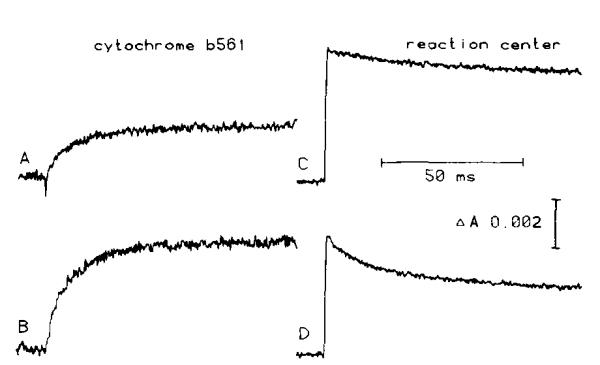
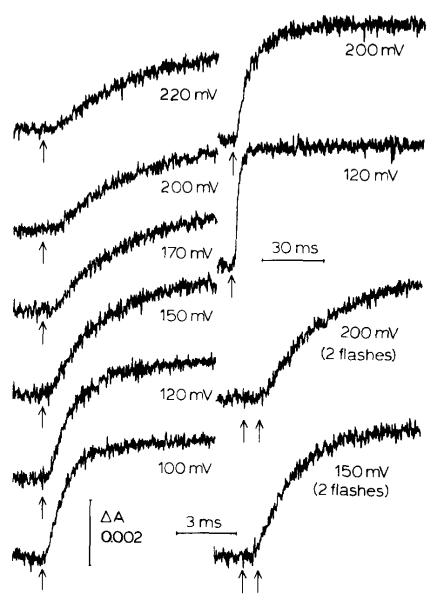
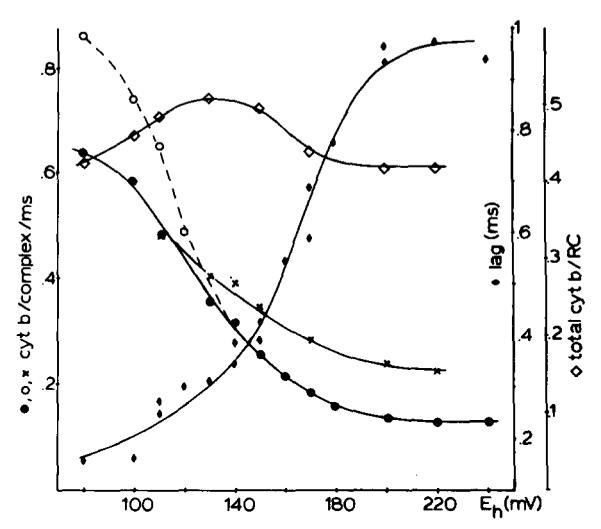
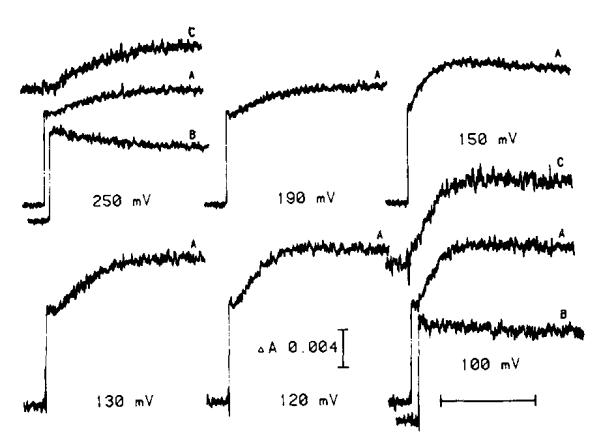
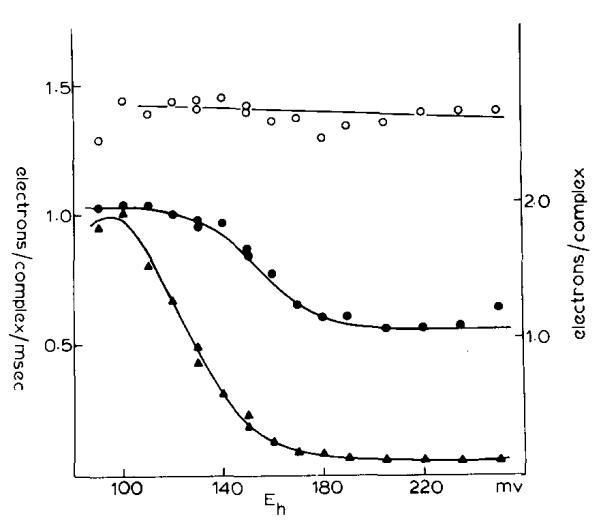
THE ROLE OF THE QUINONE POOL IN THE CYCLIC ELECTRON-TRANSFER CHAIN OF RHODOPSEUDOMONAS SPHAEROIDES: A MODIFIED Q-CYCLE MECHANISM
Abstract
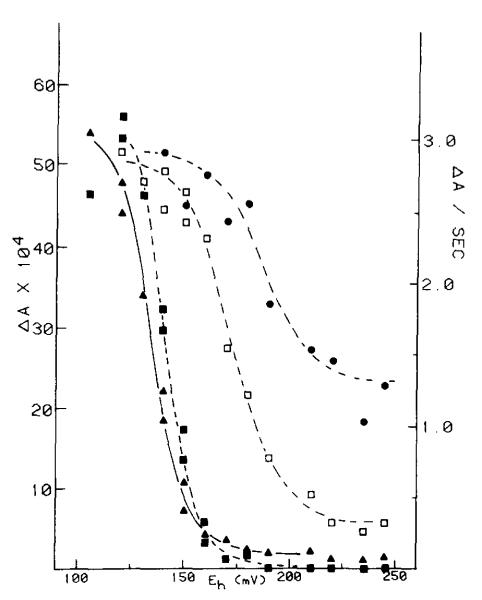
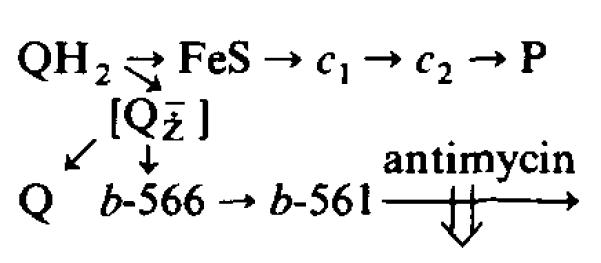
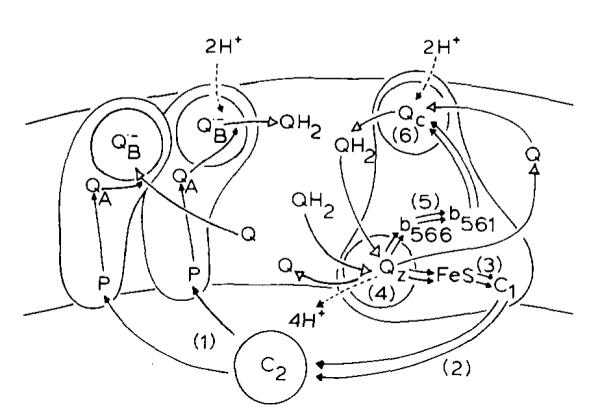
(1) The role of the ubiquinone pool in the reactions of the cyclic electron-transfer chain has been investigated by observing the effects of reduction of the ubiquinone pool on the kinetics and extent of the cytochrome and electrochromic carotenoid absorbance changes following flash illumination. (2) In the presence of antimycin, flash-induced reduction of cytochrome b-561 is dependent on a coupled oxidation of ubiquinol. The ubiquinol oxidase site of the ubiquinol:cytochrome c(2) oxidoreductase catalyses a concerted reaction in which one electron is transferred to a high-potential chain containing cytochromes c(1) and c(2), the Rieske-type iron-sulfur center, and the reaction center primary donor, and a second electron is transferred to a low-potential chain containing cytochromes b-566 and b-561. (3) The rate of reduction of cytochrome b-561 in the presence of antimycin has been shown to reflect the rate of turnover of the ubiquinol oxidase site. This diagnostic feature has been used to measure the dependence of the kinetics of the site on the ubiquinol concentration. Over a limited range of concentration (0-3 mol ubiquinol/mol cytochrome b-561), the kinetics showed a second-order process, first order with respect to ubiquinol from the pool. At higher ubiquinol concentrations, other processes became rate determining, so that above approx. 25 mol ubiquinol/mol cytochrome b-561, no further increase in rate was seen. (4) The kinetics and extents of cytochrome b-561 reduction following a flash in the presence of antimycin, and of the antimycin-sensitive reduction of cytochrome c(1) and c(2), and the slow phase of the carotenoid change, have been measured as a function of redox potential over a wide range. The initial rate for all these processes increased on reduction of the suspension over the range between 180 and 100 mV (pH 7). The increase in rate occurred as the concentration of ubiquinol in the pool increased on reduction, and could be accounted for in terms of the increased rate of ubiquinol oxidation. It is not necessary to postulate the presence of a tightly bound quinone at this site with altered redox properties, as has been previously assumed. (5) The antimycin-sensitive reactions reflect the turnover of a second catalytic site of the complex, at which cytochrome b-561 is oxidized in an electrogenic reaction. We propose that ubiquinone is reduced at this site with a mechanism similar to that of the two-electron gate of the reaction center. We suggest that antimycin binds at this site, and displaces the quinone species so that all reactions at the site are inhibited. (6) In coupled chromatophores, the turnover of the ubiquinone reductase site can be measured by the antimycin-sensitive slow phase of the electrochromic carotenoid change. At redox potentials higher than 180 mV, where the pool is completely oxidized, the maximal extent of the slow phase is half that at 140 mV, where the pool contains approx. 1 mol ubiquinone/mol cytochrome b-561 before the flash. At both potentials, cytochrome b-561 became completely reduced following one flash in the presence of antimycin. The results are interpreted as showing that at potentials higher than 180 mV, ubiquinol stoichiometric with cytochrome b-561 reaches the complex from the reaction center. The increased extent of the carotenoid change, when one extra ubiquinol is available in the pool, is interpreted as showing that the ubiquinol oxidase site turns over twice, and the ubiquinone reductase sites turns over once, for a complete turnover of the ubiquinol:cytochrome c(2) oxidoreductase complex, and the net oxidation of one ubiquinol/complex. (7) The antimycin-sensitive reduction of cytochrome c(1) and c(2) is shown to reflect the second turnover of the ubiquinol oxidase site. (8) We suggest that, in the presence of antimycin, the ubiquinol oxidase site reaches a quasi equilibrium with ubiquinol from the pool and the high- and low-potential chains, and that the equilibrium constant of the reaction catalysed constrains the site to the single turnover under most conditions. (9) The results are discussed in the context of a detailed mechanism. The modified Q-cycle proposed is described by physicochemical parameters which account well for the results reported.
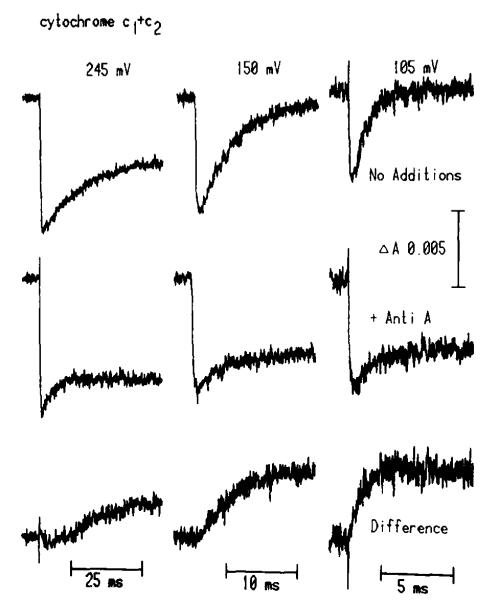
Figures
References
-
- Prince RC, Dutton PL. Ch. 24. In: Clayton RK, Sistrom WR, editors. The Photosynthetic Bacteria. Plenum Press; New York: 1978. pp. 439–453.
-
- Crofts AR, Wood P. Curr. Top. Bioenerg. 1978;1:175–244.
-
- Prince RC, O’Keefe DP, Dutton PL. In: Electron Transport and Photophosphorylation. Barber J, editor. Elsevier; Amsterdam: 1982. pp. 197–248.
-
- Evans EH, Crofts AR. Biochim. Biophys. Acta. 1974;357:89–102. - PubMed
-
- Prince RC, Dutton PL. Biochim. Biophys. Acta. 1977;462:731–747. - PubMed
Grants and funding
LinkOut - more resources
Full Text Sources
Miscellaneous
