. 2011 Mar 29;7(3):308-22.
doi: 10.7150/ijbs.7.308.

Rat mitochondrion-neuron focused microarray (rMNChip) and bioinformatics tools for rapid identification of differential pathways in brain tissues

Affiliations

Rat mitochondrion-neuron focused microarray (rMNChip) and bioinformatics tools for rapid identification of differential pathways in brain tissues

Yan A Su et al. Int J Biol Sci. .

Abstract

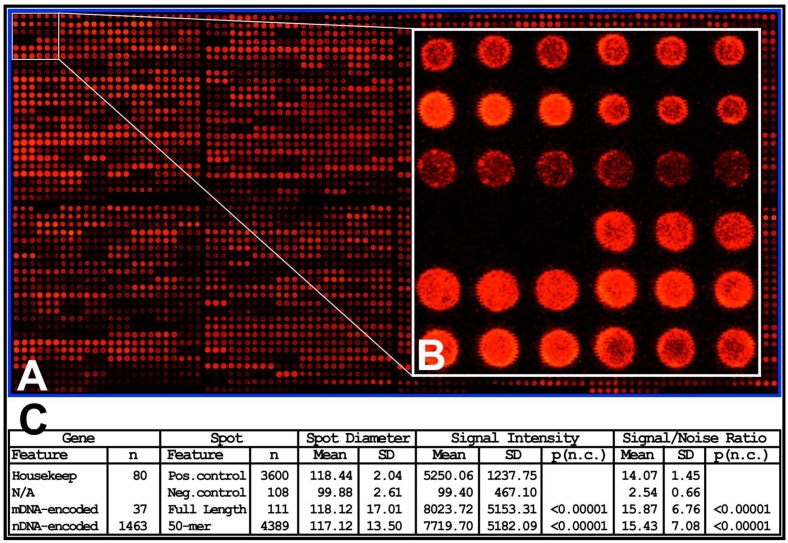
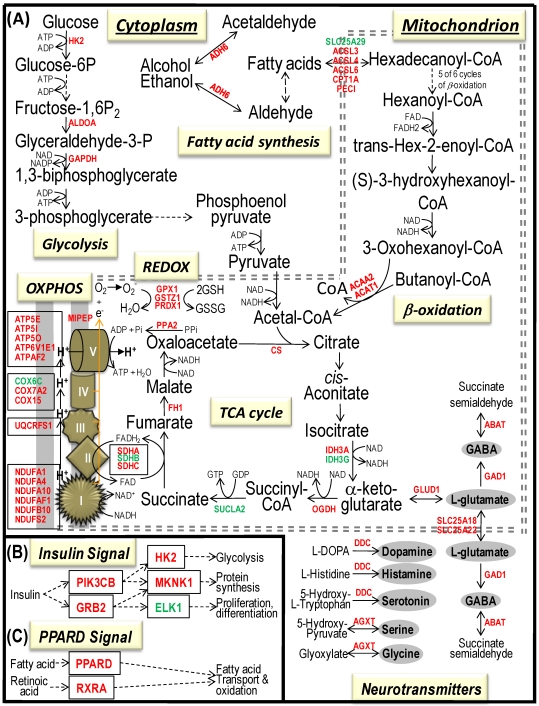
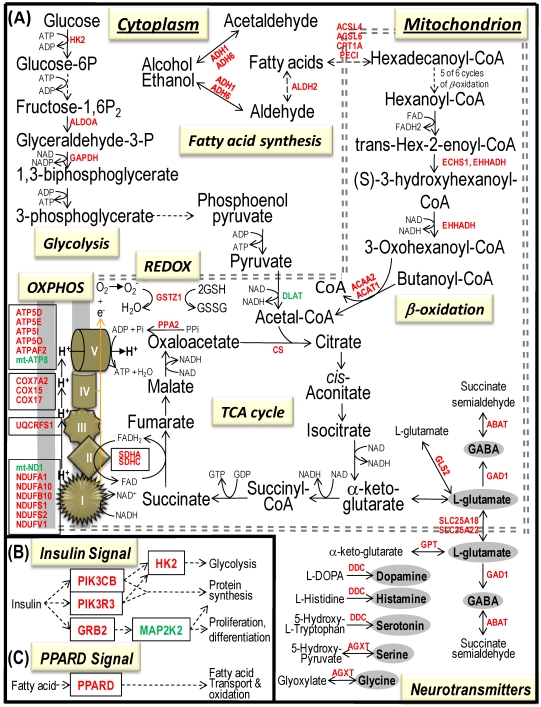
Mitochondrial function is of particular importance in brain because of its high demand for energy (ATP) and efficient removal of reactive oxygen species (ROS). We developed rat mitochondrion-neuron focused microarray (rMNChip) and integrated bioinformatics tools for rapid identification of differential pathways in brain tissues. rMNChip contains 1,500 genes involved in mitochondrial functions, stress response, circadian rhythms and signal transduction. The bioinformatics tool includes an algorithm for computing of differentially expressed genes, and a database for straightforward and intuitive interpretation for microarray results. Our application of these tools to RNA samples derived from rat frontal cortex (FC), hippocampus (HC) and hypothalamus (HT) led to the identification of differentially-expressed signal-transduction-bioenergenesis and neurotransmitter-synthesis pathways with a dominant number of genes (FC/HC = 55/6; FC/HT = 55/4) having significantly (p<0.05, FDR<10.70%) higher (≥1.25 fold) RNA levels in the frontal cortex than the others, strongly suggesting active generation of ATP and neurotransmitters and efficient removal of ROS. Thus, these tools for rapid and efficient identification of differential pathways in brain regions will greatly facilitate our systems-biological study and understanding of molecular mechanisms underlying complex and multifactorial neurodegenerative diseases.

Keywords: Microarray; bioinformatics; canonical pathway; mitochondrion; neuroscience.


Conflict of interest statement

Competing Interests: Authors state that there is no competing conflict of interests related to this publication.

Figures

Fig 1
Fig 1
High quality rMNChip microarray. (A) Representative microarray image of rMNChip. This pseudo-colored image represents an rMNChip microarray hybridized with the Cy5-labeled target cDNA reverse-transcribed from a rat brain RNA sample. Eight printing pinss were used to print 8 sub-arrays of rMNChip and each element was printed as a spot of technical triplicates adjacent to each other. The pixel intensities on spotted probes reflect abundances of hybridized target cDNA. (B) The inset shows details of spots morphologies of 12 genes (36 spots) with signal intensities ranging from high, to low and undetectable. (C) A table summarizes information of the genes and spots in the negative controls, positive controls, mtDNA- and nDNA-encoded test genes. The differences between the negative control and the others were highly significant (p<0.0001) while the difference between the positive control and the test spots were not statistically significant (p>0.05), as expected.
Fig 2
Fig 2
Consistency of the rMNChip microarrays and data normalization. (A) The consistency in gene expression levels between the intra and inter rMNChip microarrays hybridized with the same RNA sample. A scatter plot and fitted line of signal intensities of 1,465 informative genes between two sets of genes on Array 1 and Array 2 on Slide 1 (left panel) and Array 4 and Array 5 on Slide 2 (middle panel), and between two different rMNChip microarrays (right panel). Each array was hybridized with Cy5-labeled cDNA sample synthesized from the same RNA samples via parallel microarray experiments. The normalized (but not log-transformed) signal intensities of 1,465 informative genes from one were plotted against those of the other. The strong linear relationship (y = ax + b) and the positive coefficient of determination (r2) were computed from the scatter plots and indicated in each comparison. “x”: signal intensity of a spot on one microarray, “y”: signal intensity of the corresponding spot on the other microarray. (B) Box plots of expression data before and after normalization. The quantile normalization algorithms were used to adjust the values of the background-subtracted mean pixel intensities of each and every set of 4,395 spots across intra- and inter- rMNChip microarrays hybridized with Cy5-labeled RNA samples indicated. In contrast to the boxplot of pre-normalization data (top panel), the post-normalized data distributes in the same intervals with the same density center, indicating successful adjustment of data. The post-normalized data were used for further analysis. Ln: the natural logarithm, Tis: brain tissue, Exp: microarray experiments including technical and experimental triplicates, CL: cerebellum, CR: cerebrum, FC: frontal cortex, HC: hippocampus, and HT: hypothalamus.
Fig 3
Fig 3
rMNChip database compiled in FileMaker Pro including individual expression files, gene information files and a relational expression file. Individual expression files keep raw microarray data imported from a microarray image and is linked with the relational expression file via index (a unique numerical ID to each spot on rMNChip). A gene information file keeps gene biological information, for example, canonical pathways and drug targets of genes. A relational expression file contains information on probes, array design, expression data and comparison, gene symbols and full names, and direct-links with the NCBI Entrez Gene Ontology and the PharmaGKB drugs and drug targets as indicated here. (A) A user-interface of relational gene information file displaying microarray probes, gene ID, official gene symbols and full names, gene expression comparisons and statistics, pathways, drugs and drug targets, as well as direct-links via gene IDs to the NCBI Entrez Gene website and the PharmaGKB for instantly checking or updating information. (B) An example of linking of dopa decarboxilase (Ddc) to the NCBI Entrez Gene KEGG pathways. (C) An example of linking of Ddc to the PharmGKB drugs. The rMNChip databases allow searching, browsing, displaying, modifying, updating and exporting information.
Fig 4
Fig 4
Bioenergenesis neurotransmitter pathways with differentially expressed genes between frontal cortex and hippocampus. A solid line with arrowhead indicates a direct reaction or transport. A dashed line with arrowhead indicates more than one steps involved in passages. The RNA levels of genes in red or green colors were expressed significantly higher or lower in the frontal cortex than in hippocampus, respectively. If the changes in RNA levels were not significant (p>0.05) or less than 1.25-fold, the gene symbols or enzymes are not shown in the flow chat. The mean expression levels, standard deviations, fold changes, p-values, false discovery rate (FDR) and the full name of genes are listed in Table 2. (A) Bioenergenesis neurotransmitter pathways include glycolysis, fatty acid synthesis, and neurotransmitter synthesis in cytoplasm and β-oxidation, TCA cycle and OXPHOS, REDOX, and neurotransmitter synthesis in mitochondria. Double dashed lines represent the inner and outer mitochondrial membranes, of which a portion was enlarged to illustrate OXPHOS complexes I, II, III, IV and V with differentially expressed genes in each complex. A proton (H+) flow and ATP synthesis are indicated. REDOX enzymes (GPX1, GSTZ1 and PRDX1) are involved in removal of ROS (e.g. O2-). Mitochondrial and cytoplasmic enzymes with RNA levels higher in the frontal cortex than in hippocampus for synthesis of neurotransmitters (gray ovals) include Glud1 for synthesis of the most abundant excitatory neurotransmitter L-glutamate, GAD1 and ABAT for the most abundant inhibitory neurotransmitter γ-aminobutyric acid [GABA], DDC for dopamine, histamine and serotonin, and AGXT for serine and glycine. SLC25A18 and SLC25A22 are involved in transport of L-glutamate across mitochondrial membranes. (B) Insulin signaling pathway. Insulin binding to its receptor results in the tyrosine phosphorylation of insulin receptor substrates. This leads to activation of phosphoinositide-3-kinase (PIK3CB) and growth factor receptor-bound protein (GRB2). These in turn lead to upregulation of insulin-responsive genes including hexokinase 2 (HK2) and MAP kinase interacting serine/threonine kinase 1 (MKNK1). HK2 at the outer mitochondrial membrane phosphorylates glucose into glucose-6-phosphate, the first rate-limiting step of glycolysis pathway. MKNK1 in cytoplasm phosphorylates the eukaryotic translation initiation factor (EEIF4E) initiating protein synthesis, of which 18 of 25 genes displayed RNA levels higher in the frontal cortex than in hippocampus (Table 2). MKNK1 also modifies proteins posttranslationally. ELK1 member of ETS oncogene family (ELK1) plays a critical role in mitogen growth factor signal transduction, and its downregulation suggests decreased activities in proliferation and differentiation. (C) PPARD signaling pathway. Peroxisome proliferator-activated receptor delta (PPARD) is a nuclear hormone receptor and transcriptional regulator. Retinoid X receptor alpha (RXRA) is a steroid and thyroid hormone receptor and transcriptional regulator. Both PPARD and RXRA are involved in fatty acid transport and oxidation via binding to DNA and regulating transcription.
Fig 5
Fig 5
Bioenergenesis neurotransmitter pathways with differentially expressed genes between frontal cortex and hypothalamus. A solid line with arrowhead indicates a direct reaction or transport. A dashed line with arrowhead indicates more than one steps involved in passages. The RNA levels of genes in red or green colors were expressed significantly higher or lower in the frontal cortex than in hypothalamus, respectively. If the changes in RNA levels were not significant (p>0.05) or less than 1.25-fold, the gene symbols or enzymes are not shown in the flow chat. The mean expression levels, standard deviations, fold changes, p-values, false discovery rate (FDR) and the full name of genes are listed in Table 2. (A) Bioenergenesis neurotransmitter pathways include glycolysis, fatty acid synthesis, and neurotransmitter synthesis in cytoplasm and β-oxidation, TCA cycle and OXPHOS, REDOX, and neurotransmitter synthesis in mitochondria. Double dashed lines represent the inner and outer mitochondrial membranes, of which a portion was enlarged to illustrate OXPHOS complexes I, II, III, IV and V with differentially expressed genes in each complex. A proton (H+) flow and ATP synthesis are indicated. REDOX enzyme (GSTZ1) is involved in removal of ROS (e.g. O2-). Mitochondrial and cytoplasmic enzymes with the RNA levels higher in the frontal cortex than in hypothalamus for synthesis of neurotransmitters (gray ovals) include GLS2 and GPT for synthesis of the most abundant excitatory neurotransmitter L-glutamate, GAD1 and ABAT for the most abundant inhibitory neurotransmitter γ-aminobutyric acid [GABA], DDC for dopamine, histamine and serotonin, and AGXT for serine and glycine. SLC25A18 and SLC25A22 are involved in transport of L-glutamate across mitochondrial membranes. (B) Insulin signaling pathway. Insulin binding to its receptor results in the tyrosine phosphorylation of insulin receptor substrates. This leads to activation of phosphoinositide-3-kinase (PIK3CB and PIK3R3) and growth factor receptor-bound protein (GRB2). The activated PIK3CB and PIK3R3 lead to upregulation insulin-responsive genes including hexokinase 2 (HK2). HK2 localizes to the outer mitochondrial membrane and phosphorylates glucose into glucose-6-phosphate, the first rate-limiting step of glycolysis pathway. PIK3CB and PIK3R3 also activate protein synthesis, of which 22 of 23 genes displayed RNA levels higher in the frontal cortex than in hypothalamus (Table 1). Mitogen-activated protein kinase kinase (MAP2K2) plays a critical role in mitogen growth factor signal transduction, and its downregulation suggests decreased activities in transferring the GRB2 signal for proliferation and differentiation. (C) PPARD signaling pathway. Peroxisome proliferator-activated receptor delta (PPARD) is a nuclear hormone receptor and transcriptional regulator and is involved in fatty acid transport and oxidation via binding to DNA and regulating transcription.

Similar articles

Cited by

References

    1. Zhang L, Zhou R, Li X, Ursano RJ, Li H. Stress-induced change of mitochondria membrane potential regulated by genomic and non-genomic GR signaling: a possible mechanism for hippocampus atrophy in PTSD. Med Hypotheses. 2006;66(6):1205–8. - PubMed
    1. Manoli I, Alesci S, Blackman MR, Su YA, Rennert OM, Chrousos GP. Mitochondria as key components of the stress response. Trends Endocrinol Metab. 2007 Jul;18(5):190–8. - PubMed
    1. Su YA, Wu J, Zhang L, Zhang Q, Su DM, He P. et al. Dysregulated mitochondrial genes and networks with drug targets in postmortem brain of patients with posttraumatic stress disorder (PTSD) revealed by human mitochondria-focused cDNA microarrays. Int J Biol Sci. 2008;4(4):223–35. - PMC - PubMed
    1. Scheffler IE. A century of mitochondrial research: achievements and perspectives. Mitochondrion. 2001 Jun;1(1):3–31. - PubMed
    1. McBride HM, Neuspiel M, Wasiak S. Mitochondria: more than just a powerhouse. Curr Biol. 2006 Jul 25;16(14):R551–R560. - PubMed

Publication types

MeSH terms

Substances