. 2011 Apr 11;6(4):e18543.
doi: 10.1371/journal.pone.0018543.

Production of IFN-β during Listeria monocytogenes infection is restricted to monocyte/macrophage lineage

Affiliations

Production of IFN-β during Listeria monocytogenes infection is restricted to monocyte/macrophage lineage

Evgenia Solodova et al. PLoS One. .

Abstract

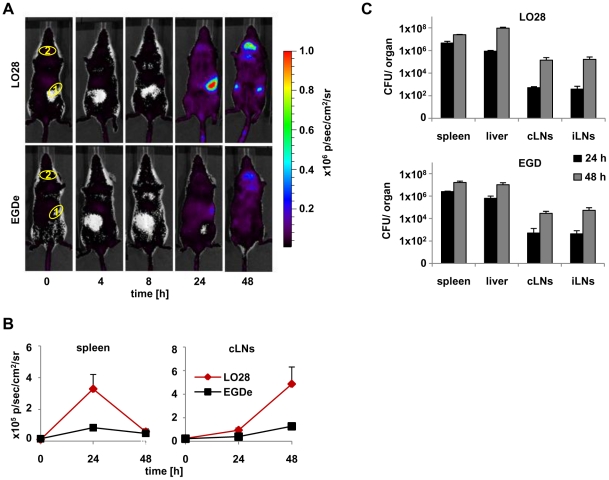
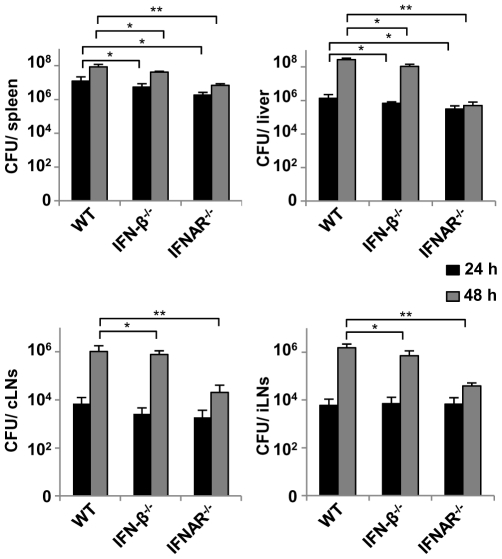
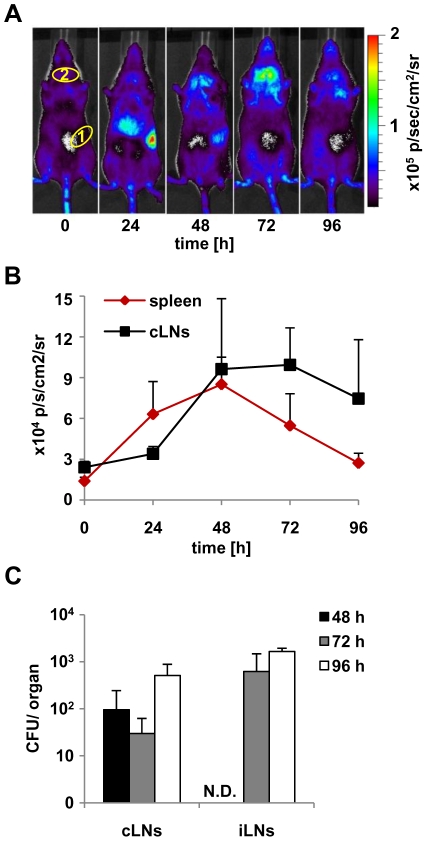
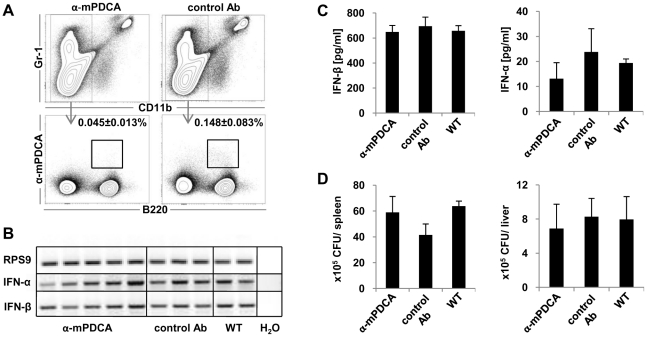
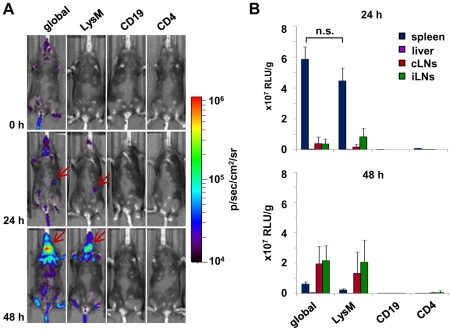
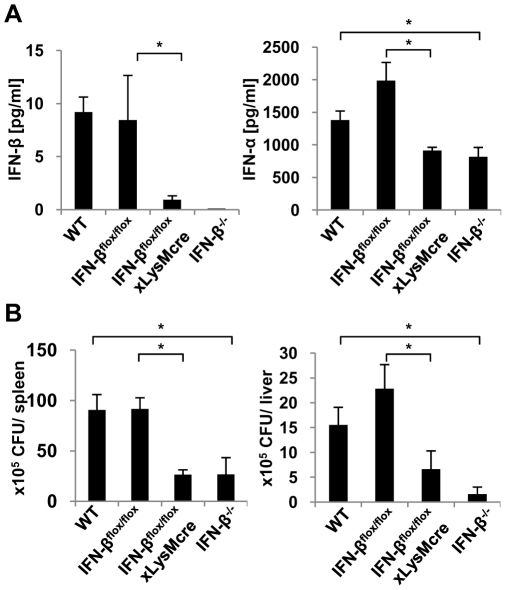
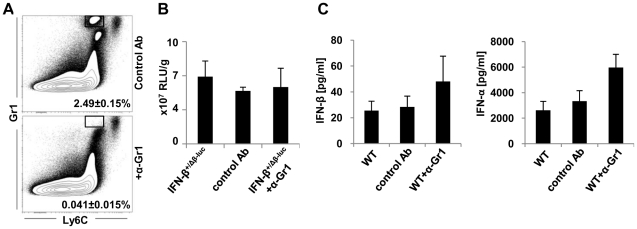
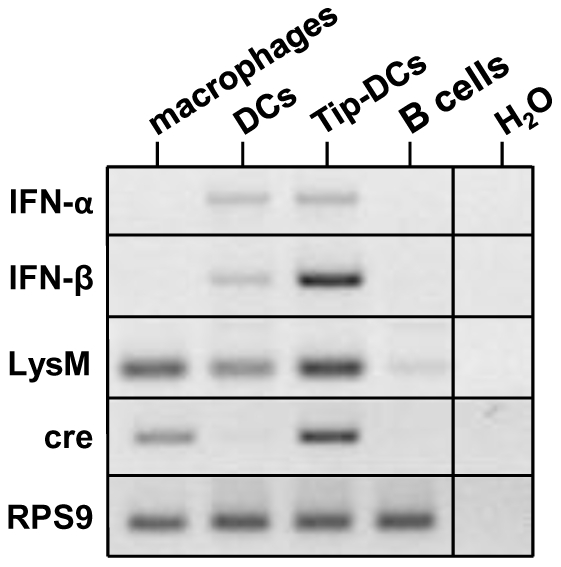
The family of type I interferons (IFN), which consists of several IFN-α and one IFN-β, are produced not only after stimulation by viruses, but also after infection with non-viral pathogens. In the course of bacterial infections, these cytokines could be beneficial or detrimental. IFN-β is the primary member of type I IFN that initiates a cascade of IFN-α production. Here we addressed the question which cells are responsible for IFN-β expression after infection with the intracellular pathogen Listeria monocytogenes by using a genetic approach. By means of newly established reporter mice, maximum of IFN-β expression was observed at 24 hours post infection in spleen and, surprisingly, 48 hours post infection in colonized cervical and inguinal lymph nodes. Colonization of lymph nodes was independent of the type I IFN signaling, as well as bacterial dose and strain. Using cell specific reporter function and conditional deletions we could define cells expressing LysM as the major IFN-β producers, with cells formerly defined as Tip-DCs being the highest. Neutrophilic granulocytes, dendritic cells and plasmacytoid dendritic cells did not significantly contribute to type I IFN production.


Conflict of interest statement

Competing Interests: The authors have declared that no competing interests exist.

Figures

Figure 1
Figure 1. Induction of IFN-β after L. monocytogenes infection is restricted to spleen and lymph nodes.
A) Albino IFN-β+/Δβ-luc mice on the C57BL/6 background were infected intravenously (i.v.) with 5×10⁵ L. monocytogenes LO28 and EGDe strains. At the indicated time points, mice were injected with luciferin (i.v.) and luciferase activity was visualized in the IVIS 200 whole body imaging system. The areas encircled in yellow are the regions of interest used for quantification in Fig. 1B. B) Quantification of in vivo imaging presented in Fig. 1A by measuring of luminescence intensity within the selected regions of interest (1 and 2 for spleen and cervical lymph nodes, respectively) at the depicted time points. C) C57BL/6 mice were infected i.v. with 5×10⁵ L. monocytogenes LO28 and EGDe strains. Bacterial loads of indicated organs were determined at 24 and 48 hours post infection. White spots observed at the 0/4/8 hour time points represent areas below the set detection limit. “cLNs” and “iLNs” stand for cervical and inguinal lymph nodes respectively. Graphs are taken from 1 representative experiment with 5 mice per group. The experiment was repeated twice.
Figure 2
Figure 2. Colonization of spleen, liver, cervical and inguinal lymph nodes is independent of type I IFN.
C57BL/6, IFN-β−/− and IFNAR−/− mice were infected intravenously with 5×10⁵ L. monocytogenes LO28. Bacterial loads of indicated organs were determined 24 and 48 hours after infection. “cLNs” and “iLNs” stand for cervical and inguinal lymph nodes respectively. Experiment was done twice with 3 animals per group. Results are expressed as means. Student's t-test was used for statistical analysis. *p<0.05, **p<0.001.
Figure 3
Figure 3. Colonization of and IFN-β production in lymph nodes after low dose infection.
Albino IFN-β+/Δβ-luc mice on C57BL/6 background were infected intravenously (i.v.) with 2×10³ L. monocytogenes LO28. A) At the indicated time points, mice were injected with luciferin (i.v.) and luciferase activity was visualized in the IVIS 200 whole body imaging system. The areas encircled in yellow are the regions of interest used for quantification in Fig. 3B. B) Quantification of in vivo imaging presented in Fig. 3A by measuring of luminescence intensity within the selected regions of interest (1 and 2 for spleen and cervical lymph nodes, respectively) at the depicted time points. C) Bacterial loads of organs at different time points post infection. N.D. indicates not detected. “cLNs” and “iLNs” stand for cervical and inguinal lymph nodes, respectively. Graphs are taken from 1 representative experiment with 6–10 mice per group. The experiment was repeated twice.
Figure 4
Figure 4. Plasmacytoid dendritic cells do not produce type I IFN during Listeria monocytogenes infection.
pDCs were depleted in vivo by intravenous (i.v.) injection of 100 µg anti-mPDCA-1 mAb 24 hours prior L. monocytogenes LO28 infection. As isotype control, rat IgG was used. C57BL/6 mice were infected with 5×10⁵ bacteria i.v., 24 hour post infection spleens and sera were harvested. A) Gating strategy and percentage of pDCs in spleens. B) Expression of IFN-β and IFN-α was analyzed by RT-PCR. RPS9 was used as housekeeping gene to control the amount of cDNA employed in the assay. C) Serum levels of IFN-β and total IFN-α were analyzed by ELISA. D) Bacterial loads from spleen and liver. “α-mPDCA” stands for mice depleted of pDCs; “control Ab” stands for mice injected with isotype control IgG; “WT” stands for mice injected with PBS. Graphs display one representative experiment with 3–5 mice per group. The experiment was repeated 3 times.
Figure 5
Figure 5. Monocytes/macrophages/neutrophils produce IFN-β in spleen, cervical and inguinal lymph nodes.
Mice of indicated phenotypes were infected intravenously (i.v.) with 5×10⁵ L. monocytogenes LO28. Mice are on the C57BL/6 genetic background. The albino gene was not yet crossed in. “global” stands for IFN-β+/Δβ-luc; “CD4”, “CD19” and “LysM” stand for IFN-β+/floxβ-luc x CD4cre, IFN-β+/floxβ-luc x CD19cre and IFN-β+/floxβ-luc x LysMcre, respectively. A) At the depicted time points after infection, mice were injected with luciferin (i.v.) and luciferase activity was visualized in the IVIS 200 imaging system. Low signals are due to quenching of the bioluminescent light by melanin in fur and skin of the C57BL/6 mice. Red arrows indicate location of spleen and cervical lymph nodes at 24 and 48 hours post infection, respectively. B) For quantification of luciferase activity, indicated tissues were harvested 24 and 48 hours post infection and organ homogenates were analyzed in a luminometer. “cLNs” and “iLNs” stand for cervical and inguinal lymph nodes respectively. Experiment was done twice with 3–5 animals per group. Results are expressed as means. Student's t-test was used for statistical analysis. n.s. stands for not significant, p>0.05.
Figure 6
Figure 6. Ablation of IFN-β production in LysM-expressing cells is equal to the overall absence of IFN-β.
Mice of indicated genotypes were infected intravenously with 5×10⁵ L. monocytogenes LO28. 24 hours post infection mice were sacrificed and spleens, livers and serum were isolated. “WT” stands for C57BL/6, “IFN-βflox/flox” stands for IFN-βfloxβ-luc/floxβ-luc and “IFN-βflox/floxxLysMcre” stands for IFN-βfloxβ-luc/floxβ-luc x LysMcre. A) Serum levels of IFN-β and total IFN-α were analyzed by ELISA. B) Bacterial numbers from spleens and liver were calculated and presented as colony forming units (CFUs).Graphs are taken from 1 representative experiment with 3–5 mice per group. The experiment was repeated twice. Student's t-test was used for statistical analysis. *p<0.05.
Figure 7
Figure 7. Depletion of granulocytes does not influence the amount of type I IFN.
Granulocytes were depleted 24 hours prior to infection of mice with 5×10⁵ L. monocytogenes LO28. As isotype control, rat IgG was used. 24 hours post infection IFN-β+/Δβ-luc and C57BL/6 mice were sacrificed, spleens and serum were harvested. A) Percentage of granulocytes in spleens. B) For quantification of luciferase activity, spleen homogenates from IFN-β+/Δβ-luc mice were analyzed in a luminometer. C) Serum levels of IFN-β and total IFN-α from C57BL/6 mice were analyzed by ELISA. “+α-Gr1” stands for mice depleted of granulocytes. “WT” stands for C57BL/6 mice. Graphs are taken from 1 representative experiment with 3–5 mice per group. The experiment was repeated 3 times.
Figure 8
Figure 8. LysM-expressing cells include Tip-DCs - the main source of IFN-β produced after Listeria monocytogenes infection.
IFN-β+/floxβ-luc x LysMcre mice (n = 5) were infected intravenously with 5×10⁵ L. monocytogenes LO28 strain. 24 hours after infection mice were sacrificed, splenic cells were isolated and subjected to FACS sorting. RNA of the isolated cells was extracted, reverse-transcribed and subjected to PCR for the indicated genes. RPS9 was used as housekeeping gene to control the amount of cDNA employed in the assay. As a negative control H2O was used instead of cDNA template.

Similar articles

Cited by

References

    1. Isaacs A, Lindenmann J. Virus interference. I. The interferon. By A. Isaacs and J. Lindenmann, 1957. J Interferon Res. 1987;7:429–438. - PubMed
    1. Pestka S, Krause CD, Walter MR. Interferons, interferon-like cytokines, and their receptors. Immunol Rev. 2004;202:8–32. - PubMed
    1. Theofilopoulos AN, Baccala R, Beutler B, Kono DH. Type I interferons (alpha/beta) in immunity and autoimmunity. Annu Rev Immunol. 2005;23:307–336. - PubMed
    1. Taniguchi T, Takaoka A. A weak signal for strong responses: interferon-alpha/beta revisited. Nat Rev Mol Cell Biol. 2001;2:378–386. - PubMed
    1. Samuelsson CV, Lienenklaus S, Muller PP, Zawatzky R, Hauser H, et al. Transformation of mouse fibroblasts alters the induction pattern of type I IFNs after virus infection. Biochem Biophys Res Commun. 2005;335:584–589. - PubMed

Publication types

MeSH terms

Substances