. 2011 Apr 11;6(4):e18702.
doi: 10.1371/journal.pone.0018702.

Ptenb mediates gastrulation cell movements via Cdc42/AKT1 in zebrafish

Affiliations

Ptenb mediates gastrulation cell movements via Cdc42/AKT1 in zebrafish

Chen-Min Yeh et al. PLoS One. .

Abstract

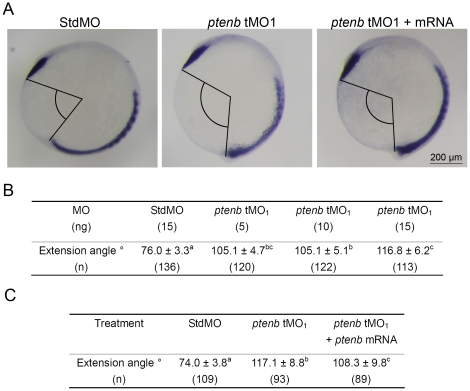
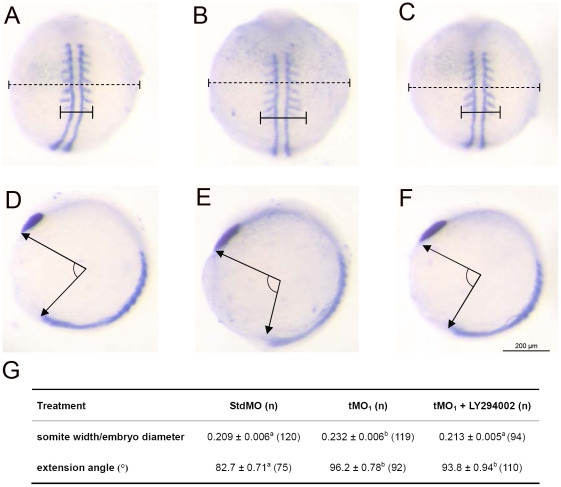
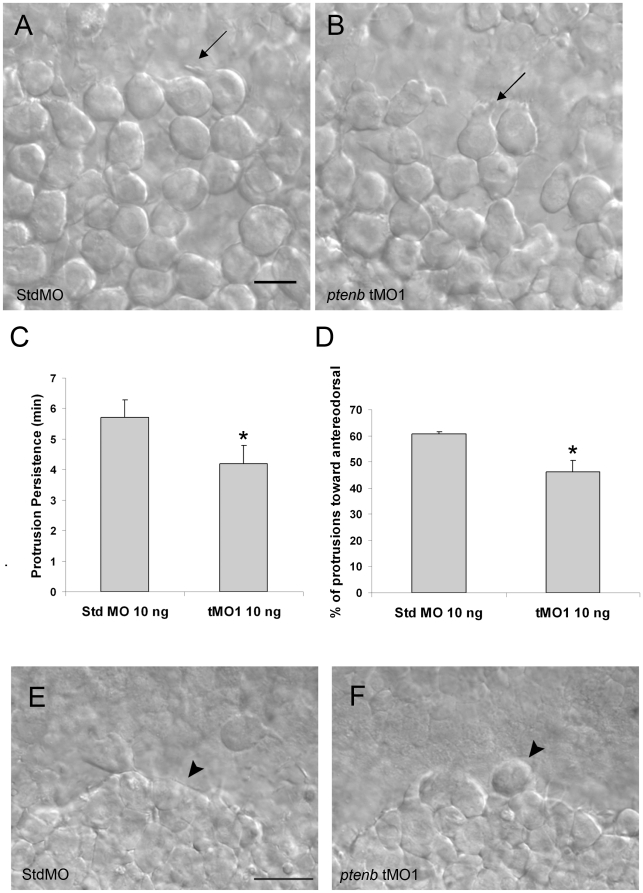
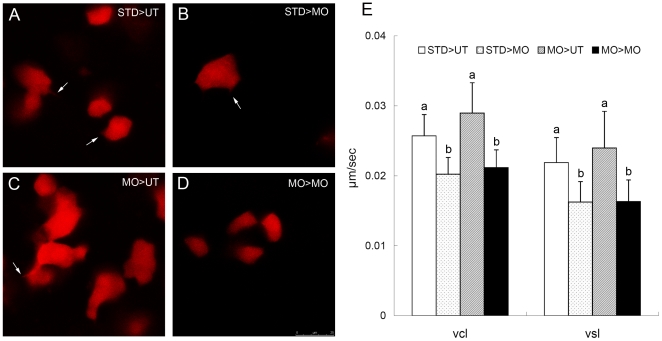
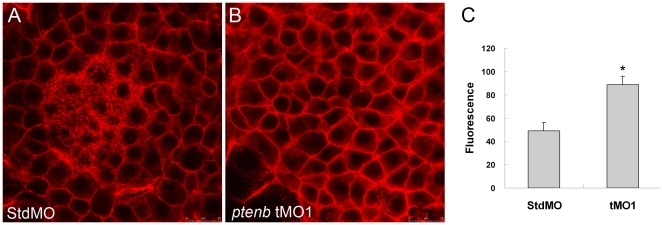
Phosphatidylinositol 3-kinase (PI3 kinase) mediates gastrulation cell migration in zebrafish via its regulation of PIP(2)/PIP(3) balance. Although PI3 kinase counter enzyme PTEN has also been reported to be essential for gastrulation, its role in zebrafish gastrulation has been controversial due to the lack of gastrulation defects in pten-null mutants. To clarify this issue, we knocked down a pten isoform, ptenb by using anti-sense morpholino oligos (MOs) in zebrafish embryos and found that ptenb MOs inhibit convergent extension by affecting cell motility and protrusion during gastrulation. The ptenb MO-induced convergence defect could be rescued by a PI3-kinase inhibitor, LY294002 and by overexpressing dominant negative Cdc42. Overexpression of human constitutively active akt1 showed similar convergent extension defects in zebrafish embryos. We also observed a clear enhancement of actin polymerization in ptenb morphants under cofocal microscopy and in actin polymerization assay. These results suggest that Ptenb by antagonizing PI3 kinase and its downstream Akt1 and Cdc42 to regulate actin polymerization that is critical for proper cell motility and migration control during gastrulation in zebrafish.


Conflict of interest statement

Competing Interests: The authors have declared that no competing interests exist.

Figures

Figure 1
Figure 1. Expression patterns of zebrafish ptenb.
(A) Expression of ptenb at designated developmental stage was examined by RT-PCR analysis of an 1183-bp ptenb fragment, and a 530-bp β-actin fragment was used as an internal control. hpf: h post fertilization. (B) Representative photographs of embryos fixed at designated stages and underwent whole-mount in situ hybridization against ptenb. Scale bar: 200 µm.
Figure 2
Figure 2. ptenb MO target sites and potency examination.
(A) Partial mRNA map of ptenb. The black and white boxes represent part of the coding sequence (CDS) with ATG translation initiation site and 5′ untranslated region (UTR), respectively. The ptenb tMO1 and tMO2 binding sites are located at the 5′ UTR as shown. The potency of tMO1 to reduce ptenb expression was shown by co-injecting 150 pg PCS2+_ptenb 5′ UTR plasmid, which containing the tMO1 binding site, with or without 5 ng tMO1. Representative photographs of control (B,C) and morphant embryos (D,E) under bright (B,D) and dark fields (C,E) are shown. These experiments were repeated 3 times.
Figure 3
Figure 3. ptenb MOs delays epibolic progression.
Knockdown of ptenb by MOs caused delay in epibolic movement in a dose-dependent manner. (A) Embryos were injected with standard MO (StdMO), tMO1, 5-bp mismatched tMO1 (mis-tMO1) and tMO2 at designated amount, incubated to 10 hpf and the percentages of embryos at each epiboly stage are shown. (B) Embryos were injected with 15 ng of StdMO or tMO1 in the absence or presence of ptenb mRNAs (50 pg), incubated and their degrees of epiboly progression are shown. Each treatment was repeated at least 6 times.
Figure 4
Figure 4. ptenb MOs specifically impairs gastrulation in a dose-dependent manner.
Knockdown of ptenb by MOs caused gastrulation defects in graded severity. Representative photographs of ptenb morphants with different severity are shown in (A) normal (B) intermediate and (C) severe. (D) Embryos were injected with StdMO, tMO1, mis-tMO1 and tMO2 at designated amount, incubated to 10 somite stage and the percentages of embryos with different severity are shown. (E) Embryos were injected with 15 ng of StdMO or tMO1 in the absence or presence of ptenb mRNAs (50 pg), incubated and their degrees of gastrulation defect are shown. Each treatment was repeated at least 4 times.
Figure 5
Figure 5. ptenb MOs cause convergence defect during gastrulation.
Embryos were injected with designated amount of MO, incubated to 9 to 11 somites and subjected to WISH against myod. The somite width of treated embryos was measured as indicated in (A). The average somite width and number of embryos used (n) in each treatment are shown in (B). These experiments were repeated at least 4 times. Values between groups with a significant difference (p<0.05) are denoted by different superscript letters.
Figure 6
Figure 6. ptenb MOs cause extension defect during gastrulation.
Embryos were treated as described in Fig. 5, but subjected to WISH against ctsl1b instead of myod. The extension angles of treated embryos were measured as indicated in (A). The average extension angle and number of embryos used (n) in each treatment are shown in (B). Rescue experiments were performed as shown in (C). These experiments were repeated at least 4 times. Values between groups with a significant difference (p<0.05) are denoted by different superscript letters.
Figure 7
Figure 7. Rescue of ptenb MO-induced convergence defect by inhibiting PI3 kinase.
Embryos were injected with 10 ng of StdMO (A,D) or tMO1 (B,E), incubated without (A,B,D,E) or with 5 µM of LY294002 (C,F) to 9 to 11 somites and subjected to WISH against myod and ctsl1b. The somite width (solid line), embryo diameter (dash line) (A–C) and extension angle (E–F) of treated embryos were measured as indicated. The average somite width/embryo diameter ratio, extension angle and sample number in each treatment are shown in (G). These experiments were repeated 5 times. Values between groups with a significant difference (p<0.05) are denoted by different superscript letters.
Figure 8
Figure 8. Cell protrusions of lateral hypoblast cells are affected by ptenb MO.
Embryos were injected with 10 ng of StdMO (A) or ptenb tMO1 (B), imaged under DIC microscopy and recorded between 75% to 85% epiboly stages. Representative snapshots are shown and arrows are pointing to typical cell protrusions. By examining a 1-h recording, the average persistent time of each protrusion (C) and the percentage of protrusions pointed anterodorsally (D) were calculated and shown for each treatment. * : p<0.05, scale bars: 25 µm.
Figure 9
Figure 9. ptenb functions non cell-autonomously to regulate the cell protrusions and cell migration during gastrulation.
(A–D) Rhodamine labeled blastomeres were transplanted from embryos injected with 10 ng of StdMO (STD) or tMO1 (MO) with rhodamine dextran to untreated hosts (UT) or tMO1 morphant hosts (MO). Host embryos were then imaged (animal pole on the top and vegetal pole at the bottom) under confocal microscopy and representative snapshots are shown in (A) STD>UT: StdMO treated cells in an untreated host. (B) STD>MO: StdMO treated cells in a tMO1 morphant. (C) MO>UT: tMO1 treated cells in an untreated host. (D) MO>MO: tMO1 treated cells in a tMO1 morphant. Arrows indicate the representative cellular protrusions in each embryo. (E) Cell transplantations were performed as described in (A–D), imaged under epifluorescent microscopy and time-lapse movies were taken for each treatment. The transplanted cells were traced and their curvillinear velocity (Vcl) and strait line velocity (Vcl) were calculated and shown. Values between groups with a significant difference (p<0.05) are denoted by different letters. Scale bar: 25 µm.
Figure 10
Figure 10. Knockdown of ptenb enhances actin polymerization.
The 10 ng StdMO (A) and 10 ng ptenb tMO1 (B)-treated embryos were fixed at 70% epiboly, stained with rhodamine-phalloidin to reveal the F-actin, observed under confocal microscopy, and photographed with vegetal view. The F-actin contents of shield stage-embryos (n = 60) were measured by actin polymerization assay as described in “Materials and Methods”. Relative fluorescence (Rf) values from three independent experiments were corrected by subtracting background Rf. * indicates the value is significantly different from that of the StdMO treatment (p<0.05). Scale bar: 25 µm.
Figure 11
Figure 11. Ptenb-mediated signal transduction during gastrulation in zebrafish.
By coordinating with PI3 kinase, Ptenb controls the balance between PIP2 and PIP3 that may activate downstream Cdc42 and AKT1 for mediating actin dynamics to regulate cell movements during gastrulation in zebrafish.

Similar articles

Cited by

References

    1. Keller R. Shaping the vertebrate body plan by polarized embryonic cell movements. Science. 2002;298:1950–1954. - PubMed
    1. Solnica-Krezel L, Cooper MS. Cellular and genetic mechanisms of convergence and extension. Results Probl Cell Differ. 2002;40:136–165. - PubMed
    1. Schier AF. Axis formation and patterning in zebrafish. Curr Opin Genet Dev. 2001;11:393–404. - PubMed
    1. Warga RM, Kimmel CB. Cell movements during epiboly and gastrulation in zebrafish. Development. 1990;108:569–580. - PubMed
    1. Solnica-Krezel L. Conserved patterns of cell movements during vertebrate gastrulation. Curr Biol. 2005;15:R213–228. - PubMed

Publication types

MeSH terms