

Fast and slow effects of medial olivocochlear efferent activity in humans
- PMID: 21494578
- PMCID: PMC3073004
- DOI: 10.1371/journal.pone.0018725
Fast and slow effects of medial olivocochlear efferent activity in humans
Abstract
Background: The medial olivocochlear (MOC) pathway modulates basilar membrane motion and auditory nerve activity on both a fast (10-100 ms) and a slow (10-100 s) time scale in guinea pigs. The slow MOC modulation of cochlear activity is postulated to aide in protection against acoustic trauma. However in humans, the existence and functional roles of slow MOC effects remain unexplored.
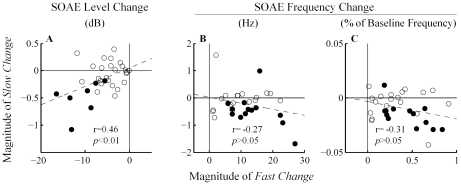
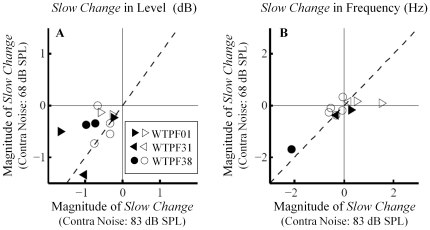
Methodology/principal findings: By employing contralateral noise at moderate to high levels (68 and 83 dB SPL) as an MOC reflex elicitor, and spontaneous otoacoustic emissions (SOAEs) as a non-invasive probe of the cochlea, we demonstrated MOC modulation of human cochlear output both on a fast and a slow time scale, analogous to the fast and slow MOC efferent effects observed on basilar membrane vibration and auditory nerve activity in guinea pigs. The magnitude of slow effects was minimal compared with that of fast effects. Consistent with basilar membrane and auditory nerve activity data, SOAE level was reduced by both fast and slow MOC effects, whereas SOAE frequency was elevated by fast and reduced by slow MOC effects. The magnitudes of fast and slow effects on SOAE level were positively correlated.
Conclusions/significance: Contralateral noise up to 83 dB SPL elicited minimal yet significant changes in both SOAE level and frequency on a slow time scale, consistent with a high threshold or small magnitude of slow MOC effects in humans.
Conflict of interest statement
Figures
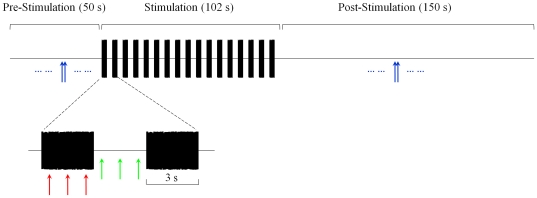
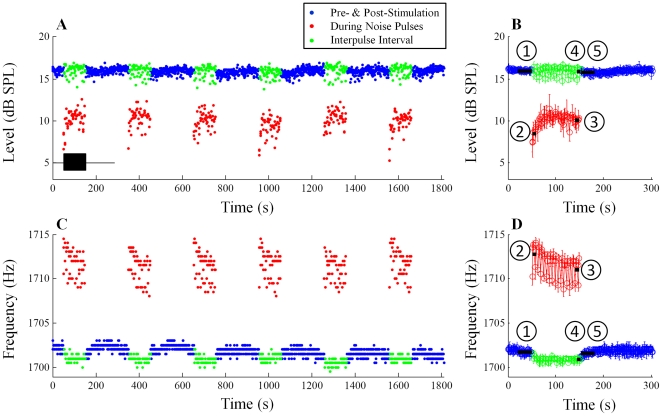
 ) is defined as the median SOAE level/frequency in the 30-s window before noise onset. Similarly, SOAE levels/frequencies during the first two noise pulses (
 ), during the last two noise pulses (
 ), during the last two inter-pulse intervals (
 ) and in the 30-s window after noise offset (
 ) were quantified. Differences from the baseline were defined as fast change (
 -
- ), adaptation change (
 -
- ), buildup change (
 -
- ) and slow change (
 -
- ). Error bars represent one standard deviation.
Similar articles
-
Medial olivocochlear efferent reflex inhibition of human cochlear nerve responses.Hear Res. 2016 Mar;333:216-224. doi: 10.1016/j.heares.2015.09.001. Epub 2015 Sep 11. Hear Res. 2016. PMID: 26364824 Free PMC article.
-
Frequency tuning of medial-olivocochlear-efferent acoustic reflexes in humans as functions of probe frequency.J Neurophysiol. 2012 Mar;107(6):1598-611. doi: 10.1152/jn.00549.2011. Epub 2011 Dec 21. J Neurophysiol. 2012. PMID: 22190630 Free PMC article.
-
Olivocochlear efferents: anatomy, physiology, function, and the measurement of efferent effects in humans.Ear Hear. 2006 Dec;27(6):589-607. doi: 10.1097/01.aud.0000240507.83072.e7. Ear Hear. 2006. PMID: 17086072 Review.
-
Electrically Evoked Medial Olivocochlear Efferent Effects on Stimulus Frequency Otoacoustic Emissions in Guinea Pigs.J Assoc Res Otolaryngol. 2017 Feb;18(1):153-163. doi: 10.1007/s10162-016-0593-5. Epub 2016 Oct 31. J Assoc Res Otolaryngol. 2017. PMID: 27798720 Free PMC article.
-
Protection from acoustic trauma is not a primary function of the medial olivocochlear efferent system.J Assoc Res Otolaryngol. 2003 Dec;4(4):445-65. doi: 10.1007/s10162-002-3013-y. Epub 2003 Jun 6. J Assoc Res Otolaryngol. 2003. PMID: 12784134 Free PMC article. Review.
Cited by
-
Auditory brainstem mechanisms likely compensate for self-imposed peripheral inhibition.Sci Rep. 2023 Aug 4;13(1):12693. doi: 10.1038/s41598-023-39850-8. Sci Rep. 2023. PMID: 37542191 Free PMC article.
-
Frequency tuning of the contralateral medial olivocochlear reflex in humans.J Neurophysiol. 2012 Jul;108(1):25-30. doi: 10.1152/jn.00051.2012. Epub 2012 Mar 28. J Neurophysiol. 2012. PMID: 22457463 Free PMC article.
-
Olivocochlear efferents: Their action, effects, measurement and uses, and the impact of the new conception of cochlear mechanical responses.Hear Res. 2018 May;362:38-47. doi: 10.1016/j.heares.2017.12.012. Epub 2017 Dec 21. Hear Res. 2018. PMID: 29291948 Free PMC article. Review.
-
Increased medial olivocochlear reflex strength in normal-hearing, noise-exposed humans.PLoS One. 2017 Sep 8;12(9):e0184036. doi: 10.1371/journal.pone.0184036. eCollection 2017. PLoS One. 2017. PMID: 28886123 Free PMC article.
-
Spontaneous Otoacoustic Emissions Reveal an Efficient Auditory Efferent Network.J Speech Lang Hear Res. 2018 Nov 8;61(11):2827-2832. doi: 10.1044/2018_JSLHR-H-18-0025. J Speech Lang Hear Res. 2018. PMID: 30458524 Free PMC article.
References
-
- Guinan JJ., Jr Olivocochlear efferents: anatomy, physiology, function, and the measurement of efferent effects in humans. Ear Hear. 2006;27:589–607. - PubMed
-
- Robles L, Delano PH. Efferent System. In: Dallos P, Oertel D, editors. The Senses: A Comprehensive Reference. 1 ed. Academic Press; 2008.
-
- Elgoyhen AB, Johnson DS, Boulter J, Vetter DE, Heinemann S. Alpha 9: an acetylcholine receptor with novel pharmacological properties expressed in rat cochlear hair cells. Cell. 1994;79:705–715. - PubMed
Publication types
MeSH terms
Grants and funding
LinkOut - more resources
Full Text Sources
Miscellaneous
