. 2011 Apr 11;6(4):e18211.
doi: 10.1371/journal.pone.0018211.

Migraine increases centre-surround suppression for drifting visual stimuli

Affiliations

Migraine increases centre-surround suppression for drifting visual stimuli

Josephine Battista et al. PLoS One. .

Abstract

Background: The pathophysiology of migraine is incompletely understood, but evidence points to hyper-responsivity of cortical neurons being a key feature. The basis of hyper-responsiveness is not clear, with an excitability imbalance potentially arising from either reduced inhibition or increased excitation. In this study, we measure centre-surround contrast suppression in people with migraine as a perceptual analogue of the interplay between inhibition and excitation in cortical areas responsible for vision. We predicted that reduced inhibitory function in migraine would reduce perceptual surround suppression. Recent models of neuronal surround suppression incorporate excitatory feedback that drives surround inhibition. Consequently, an increase in excitation predicts an increase in perceptual surround suppression.

Methods and findings: Twenty-six people with migraine and twenty approximately age- and gender-matched non-headache controls participated. The perceived contrast of a central sinusoidal grating patch (4 c/deg stationary grating, or 2 c/deg drifting at 2 deg/sec, 40% contrast) was measured in the presence and absence of a 95% contrast annular grating (same orientation, spatial frequency, and drift rate). For the static grating, similar surround suppression strength was present in control and migraine groups with the presence of the surround resulting in the central patch appearing to be 72% and 65% of its true contrast for control and migraine groups respectively (t(44) = 0.81, p = 0.42). For the drifting stimulus, the migraine group showed significantly increased surround suppression (t(44) = 2.86, p<0.01), with perceived contrast being on average 53% of actual contrast for the migraine group and 68% for non-headache controls.

Conclusions: In between migraines, when asymptomatic, visual surround suppression for drifting stimuli is greater in individuals with migraine than in controls. The data provides evidence for a behaviourally measurable imbalance in inhibitory and excitatory visual processes in migraine and is incompatible with a simple model of reduced cortical inhibitory function within the visual system.


Conflict of interest statement

Competing Interests: The authors have declared that no competing interests exist.

Figures

Figure 1
Figure 1. Schematic representation of the centre-surround contrast discrimination task.
Consecutive stimuli were presented to participants who indicated which of the two intervals had the centre stimulus of higher contrast. The target stimulus (front panel) was presented for 500 ms followed by a 500 ms inter-stimulus interval. A second stimulus was then displayed for 500 ms and was comprised of either the target stimulus alone (no-surround condition) or surrounded by an annulus of 95% contrast with a radius of 4 degrees (surround condition – back panel). The smaller centre stimulus had a radius of 0.67 degrees and seven different contrast levels were randomly presented.
Figure 2
Figure 2. Example psychometric function for a single participant.
The filled and open symbols show the raw data collected for the no surround and surround conditions respectively. Fitted curves are the best fitting cumulative Gaussian distributions to the data. The curves have similar spreads (slope of the psychometric function), however, the presence of the annular surround results in a leftwards shift of the curve (unfilled symbols) because the target patch appears to be lower contrast than the veridical contrast of 40% (dashed vertical line). Bias was determined as the shift in the point-of-subjective equality (PSE, mean of the best fitting cumulative Gaussian) caused by the annular surround.
Figure 3
Figure 3. Centre-surround suppression for parallel static gratings.
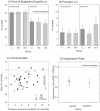
Panel A shows the PSE for the isolated centre patch (right hand side of panel: LHS) and when presented within the surround (left hand side of panel: RHS). Group means (±95% confidence intervals of the mean) are shown for control participants (C), migraine with aura (MA) and migraine without aura (MO) groups. Panel B shows the precision (spread of psychometric functions for the same groups, also for the no surround (LHS) and surround (RHS) conditions. Individual performance for each participant is shown in Panel C which plots the bias (shift in PSE) against their precision for the surround condition. Panel D shows the group mean (±95% confidence intervals of the mean) suppression ratio for the controls and all pooled migraine participants. The suppression ratio was determined as the PSE for the surround condition divided by that for the no surround condition. A ratio of 1 indicates that the surround has no effect. A reduction in the apparent contrast of the central patch due to the surround results in a suppression index less than 1.
Figure 4
Figure 4. Centre surround suppression for parallel drifting gratings.
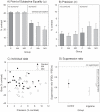
Panel A shows the PSE for the isolated centre patch (right hand side of panel: LHS) and when presented within the surround (left hand side of panel: RHS). Group means (±95% confidence intervals of the mean) are shown for control participants (C), migraine with aura (MA) and migraine without aura (MO) groups. Panel B shows the precision (spread of psychometric functions for the same groups, also for the no surround (LHS) and surround (RHS) conditions. Individual performance for each participant is shown in Panel C which plots the bias (shift in PSE) against their precision for the surround condition. Panel D shows the group mean (±95% confidence intervals of the mean) suppression ratio for the controls and all pooled migraine participants. The suppression ratio was determined as the PSE for the surround condition divided by that for the no surround condition. A ratio of 1 indicates that the surround has no effect. A reduction in the apparent contrast of the central patch due to the surround results in a suppression index less than 1.

Similar articles

Cited by

References

    1. Lipton RB, Bigal ME. The epidemiology of migraine. Am J Med. 2005;118:3S–10S. - PubMed
    1. Lipton RB, Scher AI, Kolodner K, Steiner TJ, Stewart WF. Migraine in the United States: epidemiology and patterns of health care use. Neurology. 2002;58:885–894. - PubMed
    1. Stovner LJ, Hagen K, Jensen R, Katsarava Z, Lipton RB, et al. The global burden of headache: a documentation of headache prevalence and disability worldwide. Cephalalgia. 2007;27:193–210. - PubMed
    1. The International Headache Society. The International Classification of Headache Disorders. Cephalalgia. 2004;24 - PubMed
    1. Shepherd AJ. Increased visual after-effects following pattern adaptation in migraine: a lack of intracortical excitation? Brain. 2001;124:2310–2318. - PubMed

Publication types