. 2011 Apr 11;6(4):e18179.
doi: 10.1371/journal.pone.0018179.

Regulatory response to carbon starvation in Caulobacter crescentus

Affiliations

Regulatory response to carbon starvation in Caulobacter crescentus

Leticia Britos et al. PLoS One. .

Abstract

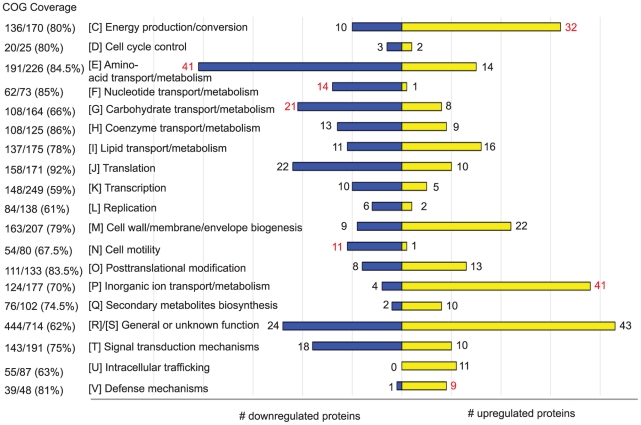
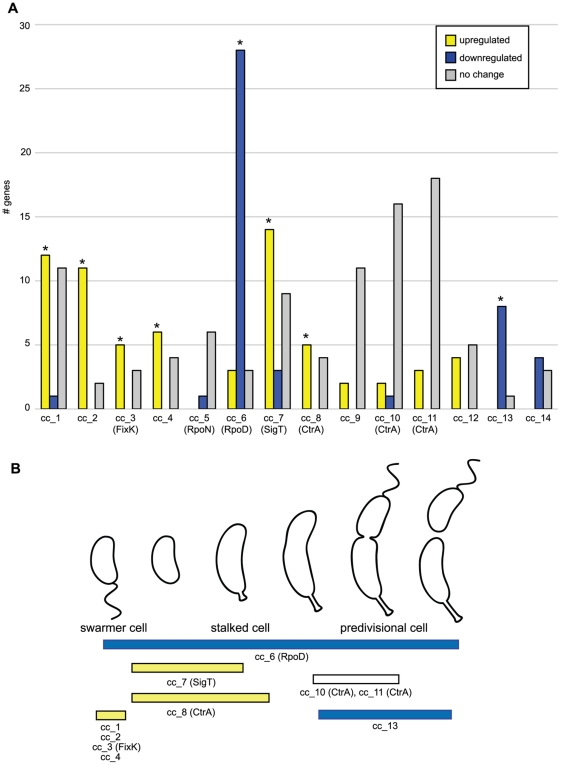
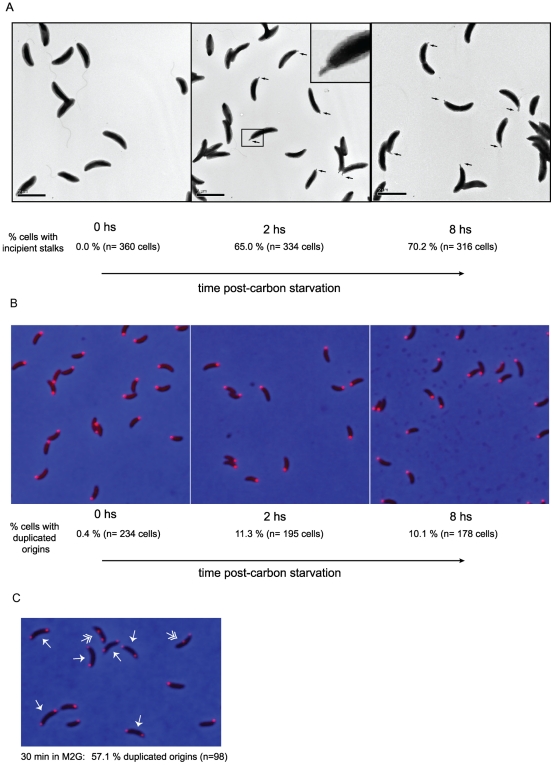
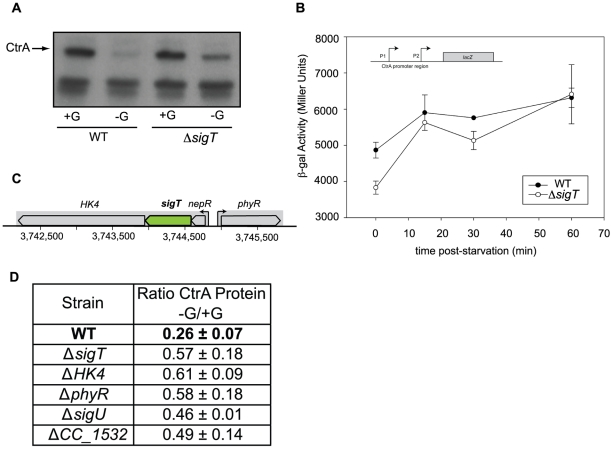
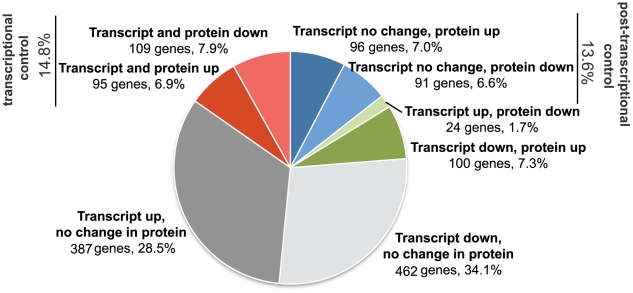
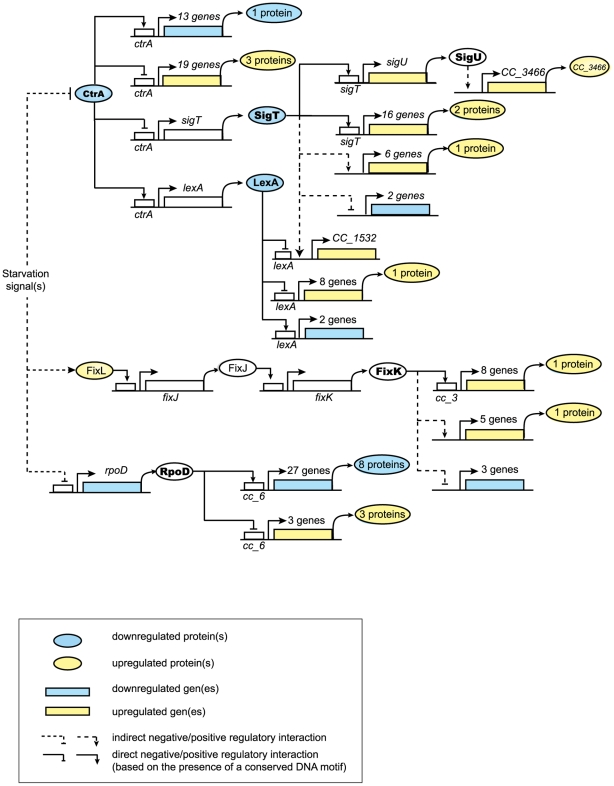
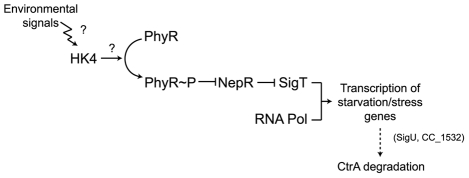
Bacteria adapt to shifts from rapid to slow growth, and have developed strategies for long-term survival during prolonged starvation and stress conditions. We report the regulatory response of C. crescentus to carbon starvation, based on combined high-throughput proteome and transcriptome analyses. Our results identify cell cycle changes in gene expression in response to carbon starvation that involve the prominent role of the FixK FNR/CAP family transcription factor and the CtrA cell cycle regulator. Notably, the SigT ECF sigma factor mediates the carbon starvation-induced degradation of CtrA, while activating a core set of general starvation-stress genes that respond to carbon starvation, osmotic stress, and exposure to heavy metals. Comparison of the response of swarmer cells and stalked cells to carbon starvation revealed four groups of genes that exhibit different expression profiles. Also, cell pole morphogenesis and initiation of chromosome replication normally occurring at the swarmer-to-stalked cell transition are uncoupled in carbon-starved cells.


Conflict of interest statement

Competing Interests: The authors have declared that no competing interests exist.

Figures

Figure 1
Figure 1. Proteome profile of C. crescentus subjected to carbon starvation.
Proteins that change significantly upon 30 and/or 60 minutes of carbon starvation classified by NCBI Clusters of Orthologous Genes (COG). Coverage for all categories of the COG scheme (except for A and B for which no proteins were detected), is indicated as the ratio of the number of detected proteins in each category over the total number of proteins assigned to that category (the corresponding percentage value is indicated in parentheses). Yellow bars represent upregulated proteins and blue bars, downregulated proteins in each COG category. Values that meet a statistically significant enrichment, assuming a hypergeometric distribution, are denoted in red. The proteins within each category are listed in Table S2, along with 43 additional proteins that are not included in the COG classification.
Figure 2
Figure 2. Putative regulators of the carbon starvation response.
A. Previously identified clusters of C. crescentus genes that share conserved promoter motifs were analyzed for enrichment in genes that change significantly upon carbon starvation. For each gene set, cc_1 through cc_14 (identified by a shared promoter motif), the number of carbon starvation upregulated genes is indicated in yellow, downregulated genes in blue and genes that don't change in gray. Asterisks denote statistically significant enrichment. Gene numbers correspond to 30 min of carbon starvation, except for motif cc_7, for which gene numbers correspond to 60 min of carbon starvation. Identical results were obtained in terms of significant enrichment for the 30 and 60 min carbon starvation data for most gene sets, except for cc_8, which was only enriched in starvation upregulated genes at 30 min, and cc_7, which was only enriched at 60 min. B. Cell cycle patterns of expression, as previously determined , of carbon-starvation enriched gene sets. Yellow indicates enrichment in genes up-regulated upon 30 min of carbon starvation, while blue corresponds to enrichment in genes down-regulated upon 30 min of carbon starvation.
Figure 3
Figure 3. Cell stage-specific carbon starvation response.
A. Diagram of the experimental design to explore the cell-stage specific response to carbon starvation. Isolated swarmer (SW) cells were subjected to glucose starvation for 15 min. To assess the response at the stalked cell stage (ST), swarmer cells were allowed to differentiate into stalked cells in complete minimal media for 60 min, and then subjected to glucose starvation for 15 minutes. At the indicated times, cell samples were collected and RNA extracted and transcribed to cDNA to hybridize onto Caulobacter microarray chips. PD = predivisional cell. M2 and M2G media are described in the Methods section. B. Hierarchical clustering of the transcriptional response to carbon starvation in swarmer cells and stalked cells. The values plotted are the log2-fold change ratios of the cells subjected to 15 minutes of carbon starvation and the non-starved controls. The promoter regions of the genes in each cluster (from −200 to +50 with respect to the translational start site) were used as input in the search for shared motifs using MEME. The five motifs with significant E-values and information content are shown.
Figure 4
Figure 4. Adaptive changes of swarmer cells upon carbon starvation.
A. Polar morphogenesis of wild type swarmer cells subjected to carbon starvation. Swarmer cells were incubated in M2 medium in the absence of glucose for 0, 2 and 8 hs, and visualized by electron microscopy, as described in Methods. The number of cells with incipient stalks (indicated by arrows and detailed in the inset in middle panel) was tallied for several fields and the corresponding percentage is indicated for each time point. B. Replication initiation in carbon starved swarmer cells was observed in a strain in which the parB gene was replaced with an ecfp-parB fusion, treated as described in A. At the indicated times, a sample was removed from the cultures, transferred unto an agarose pad an imaged. The number of cells with duplicated ECFP-ParB foci was counted for each time point and the percentage is indicated. C. Swarmer cells isolated for the experiment described in B were incubated in complete M2G media and imaged after 30 min. The percentage of cells with duplicated ECFP-ParB foci is indicated. Arrows indicate cells that have completed origin segregation, as evidence by ECFP-ParB foci in opposite poles, while double arrows indicate cells in the process of segregation.
Figure 5
Figure 5. SigT-dependent degradation of CtrA upon carbon starvation.
A. Levels of CtrA protein in swarmer cells in the presence and absence of a carbon source, in wild type cells and cells carrying a sigT deletion. Isolated swarmer cells from both genetic backgrounds were incubated in M2 medium in the absence or presence of 0.2% glucose. After 150 min, samples from these cultures were subjected to immunoblot analysis with an anti-CtrA polyclonal antibody. The band corresponding to CtrA is indicated with an arrow. B. A construct with the complete CtrA promoter region fused to a promoterless lacZ reporter in pRKlac290 was introduced into wild-type and sigT deletion strains. ß-galactosidase activity was measured in swarmer cells starved for carbon for up to 60 min. C. Genomic context of sigT. The coordinates correspond to the C. crescentus NA1000 genome. CC_3474 (HK = Histidine Kinase) corresponds to CCNA_3588 in NA1000; sigT corresponds to CC_3475 (CCNA_3589); nepR corresponds to CC_3476 (CCNA_3590); phyR corresponds to CC_3477 (CCNA_3591). D. Relative levels of the CtrA protein in the presence and absence of carbon, assayed as described in A, are shown for different mutant backgrounds, including deletions of genes in the genomic region of sigT, and of SigT-dependent genes (see Table 1). +G corresponds to M2 medium in the presence of 0.2% glucose; -G corresponds to M2 in the absence of glucose. The sampling times are 150 min after starvation, as in A. The error for the ratios corresponds to the standard deviation of the mean for at least two experiments.
Figure 6
Figure 6. Distribution of carbon starvation-induced changes at the transcript and protein levels.
For the 1364 genes for which we had both microarrays and proteomics valid data, and a significant change had been observed for at least one of the datasets, the intersection and exclusion sets are represented. Table S7 lists the genes that belong to each group in the distribution.
Figure 7
Figure 7. Carbon starvation regulatory pathways.
Diagram of regulatory pathways involved in the response to carbon starvation, derived from the analysis of proteomic and gene expression profile changes. Ovals represent proteins and rectangles represent genes. Genes and proteins whose levels increase significantly upon starvation are represented in yellow, and downregulated genes and proteins in blue. For example, we indicate that of the 13 genes controlled by CtrA whose transcripts were downregulated in the absence of carbon (blue rectangle), we were able to detect the down-regulation of one of the corresponding protein products (blue oval). The same schematic representation was used for all genes shown. The genes and proteins that change significantly upon carbon starvation are listed in Table S8. Putative direct regulatory interactions are based on the presence of conserved promoter sequences, while an indirect regulation is proposed if there is no evidence of DNA binding or of the presence of a conserved promoter element. For the transcript changes, the 30 min time point was considered, while both the 30 and 60 min time points were considered for the protein changes. The CtrA regulon comprises direct CtrA targets, as previously determined , that changed upon 30 min of carbon starvation determined by microarray analysis (listed in Table 2), as well as proteins encoded by direct CtrA targets that changed in the proteomic analysis at 30 and/or 60 min of carbon starvation (while most of those proteins were seen to change at the transcript level as well, SigU and LexA were observed to change only at the protein level). CtrA activation or repression was inferred by the direction of the change observed upon starvation: those genes with increased transcript levels upon starvation were inferred to be negatively regulated by CtrA (and consequently derepressed as CtrA protein levels decrease upon starvation); genes with decreased transcript levels were inferred to be positively regulated by CtrA. The SigT regulon includes the genes that showed a significant difference in transcript levels changes upon 15 min of carbon starvation in the sigT deletion strain with respect to wild type (listed in Table 1). Genes with a SigT binding motif in their promoters are represented as direct targets, while those lacking the motif, as indirect targets. The levels of proteins encoded by a subset of these genes changed significantly upon 30 and/or 60 min of carbon starvation. The SigU-dependent gene, CC_3466, showed reduced transcript levels under carbon starvation in a sigU deletion strain with respect to wild type. The LexA (SOS) regulon comprises those genes belonging to the SOS regulon –as previously determined - that changed significantly after 30 min of carbon starvation. The topology of the FixL-FixJ-FixK pathway is as determined by Crosson et al. . The FixK direct targets are those that have the cc_3 motif in their promoter, while the indirect targets were shown to be FixK-dependent by Crosson et al., but lack the cc_3 motif. The RpoD regulon comprises the genes with the cc_6 promoter motif whose transcripts levels were upregulated or downregulated upon 30 min of carbon starvation.
Figure 8
Figure 8. Diagram of the putative HK4-SigT signal transduction pathway.
Shown is an inferred pathway based on our results, suggesting that SigT, HK4 (CC_3474), PhyR, SigU and CC_1532 contribute to the degradation of CtrA upon carbon starvation.

Similar articles

Cited by

References

    1. Poindexter JS. Biological Properties and Classification of the Caulobacter Group. Bacteriol Rev. 1964;28:231–295. - PMC - PubMed
    1. Brown PJ, Hardy GG, Trimble MJ, Brun YV. Complex regulatory pathways coordinate cell-cycle progression and development in Caulobacter crescentus. Adv Microb Physiol. 2009;54:1–101. - PMC - PubMed
    1. Goley ED, Iniesta AA, Shapiro L. Cell cycle regulation in Caulobacter: location, location, location. J Cell Sci. 2007;120:3501–3507. - PubMed
    1. Holtzendorff J, Reinhardt J, Viollier PH. Cell cycle control by oscillating regulatory proteins in Caulobacter crescentus. Bioessays. 2006;28:355–361. - PubMed
    1. Jacobs-Wagner C. Regulatory proteins with a sense of direction: cell cycle signalling network in Caulobacter. Mol Microbiol. 2004;51:7–13. - PubMed

Publication types

MeSH terms