. 2011 Apr 6;6(4):e18568.
doi: 10.1371/journal.pone.0018568.

Dopaminergic neuronal loss, reduced neurite complexity and autophagic abnormalities in transgenic mice expressing G2019S mutant LRRK2

Affiliations

Dopaminergic neuronal loss, reduced neurite complexity and autophagic abnormalities in transgenic mice expressing G2019S mutant LRRK2

David Ramonet et al. PLoS One. .

Abstract

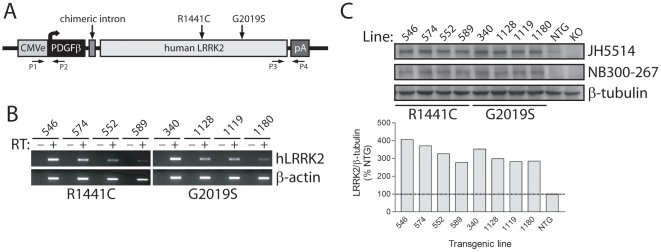
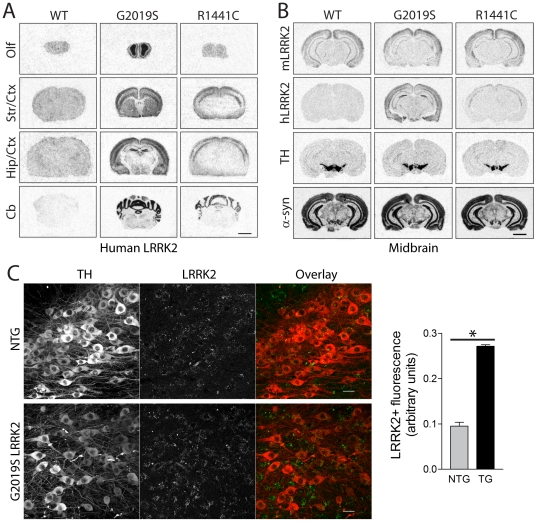
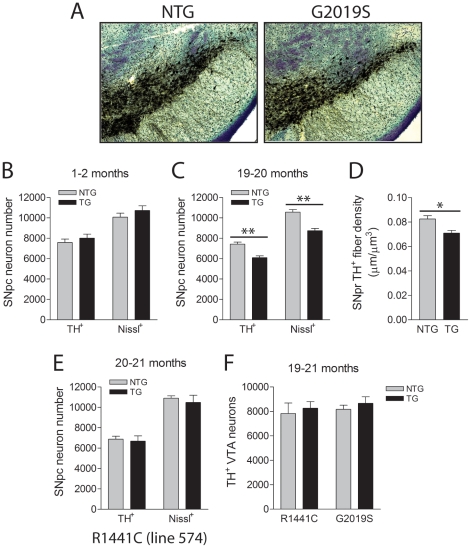
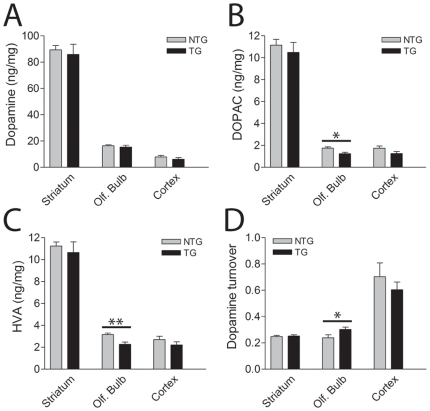
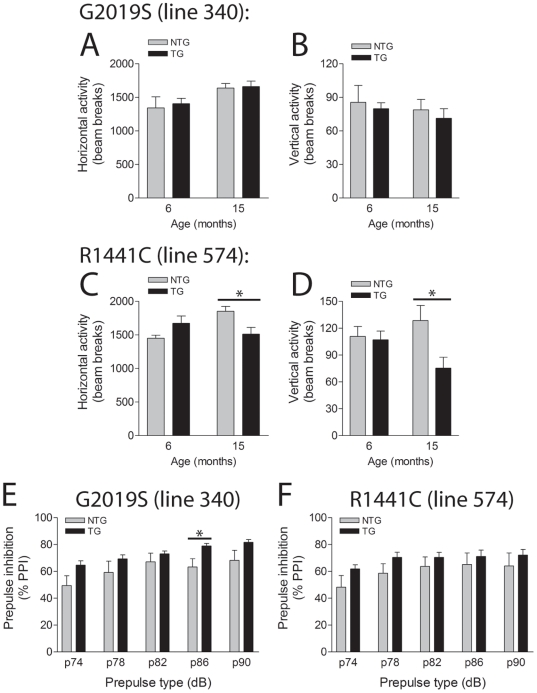
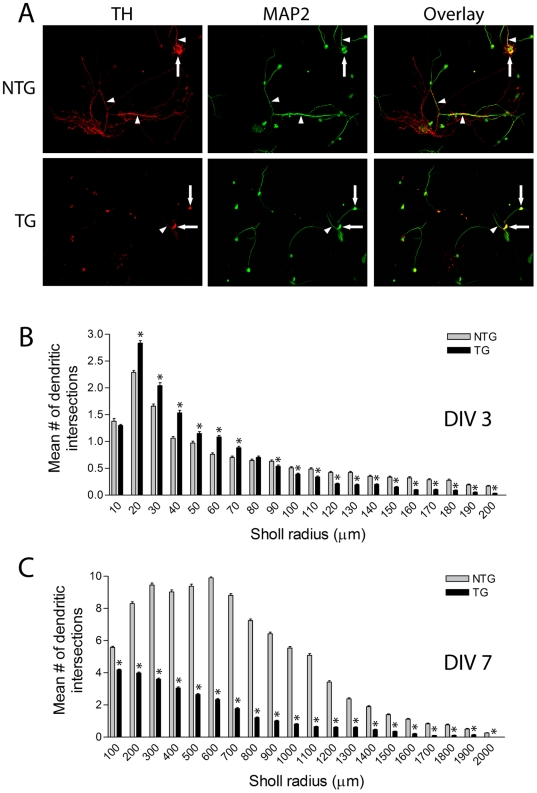
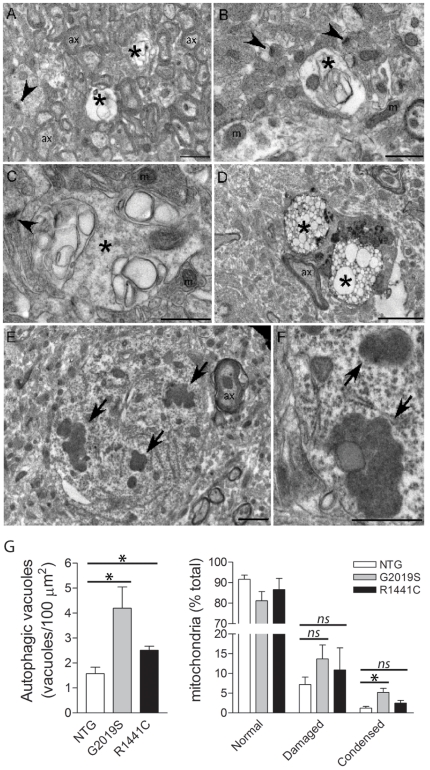
Mutations in the leucine-rich repeat kinase 2 (LRRK2) gene cause late-onset, autosomal dominant familial Parkinson's disease (PD) and also contribute to idiopathic PD. LRRK2 mutations represent the most common cause of PD with clinical and neurochemical features that are largely indistinguishable from idiopathic disease. Currently, transgenic mice expressing wild-type or disease-causing mutants of LRRK2 have failed to produce overt neurodegeneration, although abnormalities in nigrostriatal dopaminergic neurotransmission have been observed. Here, we describe the development and characterization of transgenic mice expressing human LRRK2 bearing the familial PD mutations, R1441C and G2019S. Our study demonstrates that expression of G2019S mutant LRRK2 induces the degeneration of nigrostriatal pathway dopaminergic neurons in an age-dependent manner. In addition, we observe autophagic and mitochondrial abnormalities in the brains of aged G2019S LRRK2 mice and markedly reduced neurite complexity of cultured dopaminergic neurons. These new LRRK2 transgenic mice will provide important tools for understanding the mechanism(s) through which familial mutations precipitate neuronal degeneration and PD.


Conflict of interest statement

Competing Interests: The authors have declared that no competing interests exist.

Figures

Figure 1
Figure 1. Generation of LRRK2 transgenic mice.
A, Schematic showing the CMVE-PDGFβ-LRRK2 transgene and the positions of familial PD mutations. PCR primers for 5′ (P1/P2) and 3′ (P3/P4) genotyping are indicated. B, Semi-quantitative RT-PCR analysis of human LRRK2 mRNA expression in 2–3 month LRRK2 transgenic lines. Mouse β-actin mRNA is used as a loading control. The absence (−) or presence (+) of RT enzyme in the reaction is indicated. C, Western blot analysis of soluble extracts from hemi-brains of 2–3 month LRRK2 transgenic mice (TG), non-transgenic mice (NTG) or LRRK2 knockout (KO) mice using LRRK2-specific antibodies, JH5514 (human/mouse) or human-specific NB300-267. β-tubulin is used a control for protein loading. Bar chart showing densitometric quantitation of total LRRK2 levels (JH5514 antibody) in each transgenic line. LRRK2 levels are normalized to β-tubulin levels and expressed as a percent of NTG mice.
Figure 2
Figure 2. Localization of human LRRK2 in the brain of transgenic mice.
A, In situ hybridization with 33P-labeled antisense oligonucleotide probes specific to human LRRK2 mRNA. Autoradiographs of human LRRK2 in WT (line 249), G2019S (line 340) and R1441C (line 574) transgenic mice at 2–3 months, at the level of the olfactory bulb (Olf), striatum/cortex (Str/Ctx), hippocampus/cortex (Hip/Ctx) and cerebellum (Cb). B, Localization of LRRK2 (mouse or human), and endogenous TH or α-synuclein mRNAs for comparison in adjacent midbrain sections of 2–3 month-old WT, G2019S and R1441C LRRK2 transgenic mice. C, Confocal microscopic images of LRRK2 (mouse + human; MJFF2/c41-2 antibody) and tyrosine hydroxylase (TH) immunofluorescence in the substantia nigra of 4–5 month G2019S LRRK2 transgenic (TG) mice and their non-transgenic (NTG) littermates. Bar chart showing LRRK2+ fluorescence intensity localized within nigral TH+ dopaminergic neurons of TG and NTG mice. Bars present the mean ± SEM (n = 3 mice/genotype). *P<0.001 comparing TG and NTG as indicated. Scale bar: 25 µm (C).
Figure 3
Figure 3. Progressive loss of substantia nigra dopaminergic neurons in G2019S LRRK2 transgenic mice.
A, Example of TH and Nissl staining in the substantia nigra of NTG and G2019S LRRK2 TG mice (line 340) at 19–20 months. B and C, Stereological counts for TH+ and Nissl+ neurons in the pars compacta region of NTG and G2019S LRRK2 TG mice at (B) 1–2 months (n = 7–8 mice/genotype) and (C) 19–20 months (n = 5 mice/genotype). D, Stereological measurement of TH+ dopaminergic neuritic density in the pars reticulata of NTG or TG G2019S mice at 19–20 months, expressed as average length of TH+ fibers (µm) per µm3 section area (n = 5–6 mice/genotype). E, Stereological counts of TH+/Nissl+ neurons in the pars compacta of 20–21 month NTG or R1441C LRRK2 TG mice (line 574, n = 6–8 mice/genotype). F, Stereological counts of TH+ neurons in the VTA region of 19–21 month R1441C or G2019S TG mice and their NTG littermates (n = 5 mice/genotype for G2019S or n = 7–8 for R1441C). Bars present the mean ± SEM. *P<0.02 and **P<0.005 comparing TG with NTG as indicated.
Figure 4
Figure 4. HPLC analysis of dopamine and its metabolites in G2019S LRRK2 transgenic mice.
A–D, Levels of (A) dopamine (DA) and its metabolites, (B) DOPAC and (C) HVA, and (D) dopamine turnover ([DOPAC+HVA]/DA) in the striatum, olfactory bulb and cerebral cortex of 14–15 month-old G2019S LRRK2 TG mice (line 340) and their NTG littermates by HPLC analysis (n = 8/genotype). Bars present the mean ± SEM. *P<0.05 or **P<0.005 comparing TG with NTG as indicated.
Figure 5
Figure 5. Behavioral analysis of LRRK2 transgenic mice.
A–D, In the open field G2019S LRRK2 TG mice (line 340) exhibit normal horizontal (A) and vertical (B) locomotor activity compared to NTG littermates at 6 and 15 months (n = 7–9 mice/genotype). R1441C LRRK2 TG mice (line 574) reveal normal locomotor activity at 6 months but deficits at 15 months (C and D) compared to NTG mice (n = 6-9 mice/genotype). Data represent the number of beam breaks during the first 15 min period. E–F, Normal pre-pulse inhibition (PPI) of the acoustic startle response in LRRK2 transgenic mice. E and F, G2019S and R1441C LRRK2 TG mice display normal PPI of the acoustic startle reflex at 15 months compared to their NTG littermates, with increasing pre-pulse tones of 74–90 dB (n = 6–8 mice/genotype). Data are expressed as % PPI relative to no pre-pulse tone. Bars present the mean ± SEM. *P<0.05 comparing TG with NTG as indicated.
Figure 6
Figure 6. Reduced neuritic complexity of G2019S LRRK2 dopaminergic neurons in vitro.
A, Example of neuritic morphology of immunoreactive TH+ and MAP+ dopaminergic neurons in primary midbrain cultures derived from G2019S LRRK2 TG mice (line 340) and their NTG littermates at DIV 7. TH+ neuronal soma (arrows) and neurites (arrowheads) are indicated. B–C, Sholl analysis of TH+ dopaminergic neurites plotting the mean number of dendritic intersections with circles of increasing radii at DIV 3 (B) and DIV 7 (C). Data represents the mean number of dendritic intersections within each circular interval (µm) from independent cultures derived from 4 mice per genotype. Bars present the mean ± SEM (DIV 3: NTG, n = 94 and TG, n = 150; DIV 7: NTG, n = 54 and TG, n = 71 neurons). *P<0.05 comparing TG with NTG as indicated.
Figure 7
Figure 7. Transmission electron microscopic (TEM) analysis of LRRK2 transgenic mice.
TEM analysis of cerebral cortex tissue from 17–18 month G2019S LRRK2 transgenic mice (line 340). A–D, Vacuoles with multiple membranes resembling autophagosomes or autophagic vacuoles (indicated by *) are observed within regions enriched in axons and/or synapses (A–C) or within neuronal soma (D). E and F, Clusters of condensed mitochondria within the neuronal soma (indicated by arrows) reminiscent of mitochondria that are undergoing autophagocytosis. Synapses (arrowheads), axons (ax) and normal mitochondria (m) are indicated. G, Quantitation of the density of autophagic vacuoles and the proportion of normal, damaged or condensed/aggregated mitochondria in equivalent regions of cingulate cortex from 17–26 month G2019S and R1441C LRRK2 transgenic (TG) mice relative to their non-transgenic (NTG) littermates. Bars represent the mean ± SEM (n = 3 mice/genotype). *P<0.05 comparing TG and NTG mice as indicated. Scale bars: 2 µm (A, E, F) or 1 µm (B–D).

Similar articles

Cited by

References

    1. Gasser T. Mendelian forms of Parkinson's disease. Biochim Biophys Acta. 2009;1792:587–596. - PubMed
    1. Paisan-Ruiz C, Jain S, Evans EW, Gilks WP, Simon J, et al. Cloning of the gene containing mutations that cause PARK8-linked Parkinson's disease. Neuron. 2004;44:595–600. - PubMed
    1. Zimprich A, Biskup S, Leitner P, Lichtner P, Farrer M, et al. Mutations in LRRK2 cause autosomal-dominant parkinsonism with pleomorphic pathology. Neuron. 2004;44:601–607. - PubMed
    1. Healy DG, Falchi M, O'Sullivan SS, Bonifati V, Durr A, et al. Phenotype, genotype, and worldwide genetic penetrance of LRRK2-associated Parkinson's disease: a case-control study. Lancet Neurol. 2008;7:583–590. - PMC - PubMed
    1. Moore DJ. The biology and pathobiology of LRRK2: implications for Parkinson's disease. Parkinsonism Relat Disord. 2008;14:S92–98. - PubMed

Publication types

MeSH terms

Substances

LinkOut - more resources