. 2011 Apr 8;6(4):e18361.
doi: 10.1371/journal.pone.0018361.

Optimization of the balanced steady state free precession (bSSFP) pulse sequence for magnetic resonance imaging of the mouse prostate at 3T

Affiliations

Optimization of the balanced steady state free precession (bSSFP) pulse sequence for magnetic resonance imaging of the mouse prostate at 3T

Christiane L Mallett et al. PLoS One. .

Abstract

Introduction: MRI can be used to non-invasively monitor tumour growth and response to treatment in mouse models of prostate cancer, particularly for longitudinal studies of orthotopically-implanted models. We have optimized the balanced steady-state free precession (bSSFP) pulse sequence for mouse prostate imaging.

Methods: Phase cycling, excitations, flip angle and receiver bandwidth parameters were optimized for signal to noise ratio and contrast to noise ratio of the prostate. The optimized bSSFP sequence was compared to T1- and T2-weighted spin echo sequences.

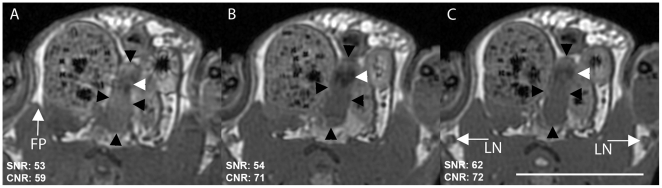
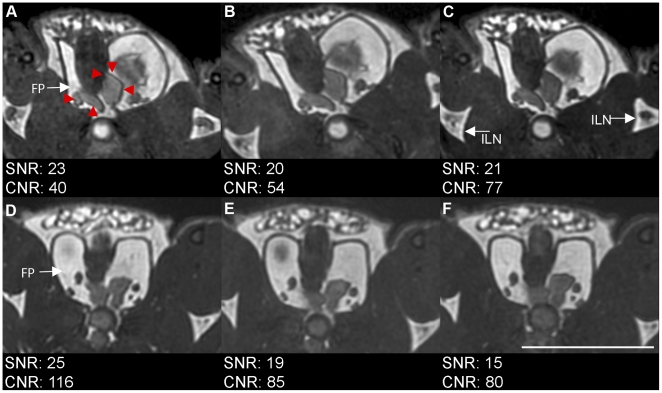
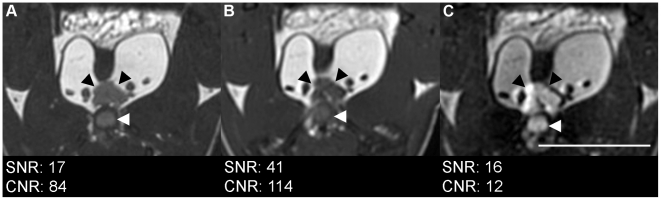
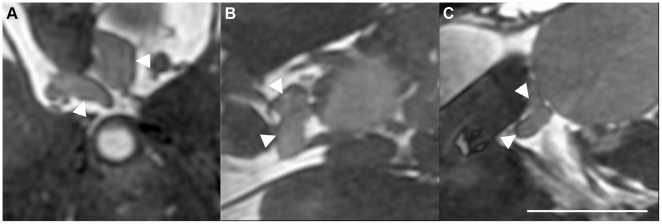
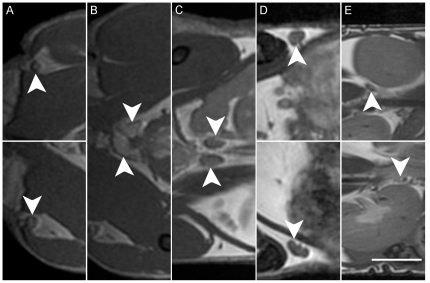
Results: SNR and CNR increased with flip angle. As bandwidth increased, SNR, CNR and artifacts such as chemical shift decreased. The final optimized sequence was 4 PC, 2 NEX, FA 50°, BW ±62.5 kHz and took 14-26 minutes with 200 µm isotropic resolution. The SNR efficiency of the bSSFP images was higher than for T1WSE and T2WSE. CNR was highest for T1WSE, followed closely by bSSFP, with the T2WSE having the lowest CNR. With the bSSFP images the whole body and organs of interest including renal, iliac, inguinal and popliteal lymph nodes were visible.

Conclusion: We were able to obtain fast, high-resolution, high CNR images of the healthy mouse prostate with an optimized bSSFP sequence.


Conflict of interest statement

Competing Interests: The authors have declared that no competing interests exist.

Figures

Figure 1
Figure 1. Effect of phase cycling and averaging on ex vivo prostate image quality.
Cropped and enlarged sections of axial scans: A: 2 PC, 4 NEX, B: 4 PC, 2 NEX, C: 8 PC, 1 NEX. Black arrowheads indicate prostate, white arrowheads urethra, FP is the fat pad used for CNR measurements and LN are the inguinal lymph nodes. Scale bar is 1 cm. Axial scan, FOV 4×4 cm, 200 µm isotropic resolution, TR/TE = 3.9/2.0 ms, FA 30°, BW ±62.5 kHz, 20 minutes.
Figure 2
Figure 2. Effect of flip angle and bandwidth on prostate visibility and artifacts.
Flip angle of A: 30° vs B: 40° vs C: 50° at BW of ±62.5 kHz. Bandwidth of D: ±31.25 kHz vs E: ±62.5 kHz vs F: ±83.3 kHz. Red arrowheads indicate prostate boundaries. White arrows point to fat pad used for CNR calculations (FP) and to inguial lymph nodes (ILN). Scale bar is 1 cm. Scan parameters: Axial scan, FOV 3×3 cm, 200 µm isotropic resolution, TR/TE = 3.3–4.6 ms/1.1–2.3 ms, 4 PC, 2 NEX, 14 minutes.
Figure 3
Figure 3. Comparison of in vivo axial views acquired with A: bSSFP, B: T1wSE and C: T2wSW.
Black arrows indicate prostate, white arrows indicate urethra. Scale bar is 1 cm. bSSFP images acquired using optimized sequence with 3×3 cm FOV. Spin echo sequences acquired with axial orientation, FOV 3×3 cm, TR/TE = 600/25 ms (T1w), 2000/70 ms (T2w), 1 mm slice thickness, 128×128 matrix, 234 mm in-plane resolution, and 20 (T1w) and 17 (T2w) minutes acquisition time.
Figure 4
Figure 4. 3 views of prostate from one in-vivo scan.
A: axial, B: coronal, C: sagittal. White arrows indicate prostate. Scale bar is 0.5 cm. Axial scan, FOV 3×3 cm, 200 µm isotropic resolution, TR/TE = 4.6 ms/2.3 ms, 4 PC, 2 NEX, FA 50°, BW ±62.5 kHz, 14 minutes.
Figure 5
Figure 5. Sections of coronal view of mouse with prostate and lymph nodes identified.
Tail is at left, head at right. White arrows indicate organs of interest as follows. A: popliteal lymph nodes; B: prostate; C: iliac lymph nodes; D: inguinal lymph nodes with lymph vessels visible; E: Renal lymph nodes. Scale bar is 0.5 cm. Coronal scan, FOV 6×3.3 cm, 200 µm isotropic resolution, TR/TE = 4.6/2.3 ms, BW ±62.5 kHz, FA 40°, 8 PC, 2 NEX, 26 minutes.

References

    1. Canadian Cancer Society. 2010. Canadian Cancer Statistics 2010.
    1. Greenberg NM, DeMayo F, Finegold MJ, Medina D, Tilley WD, et al. Prostate cancer in a transgenic mouse. Proc Nat Acad Sci USA. 1995;92:3439–3443. - PMC - PubMed
    1. Thalmann GN, Sikes RA, Wu TT, Degeorges A, Chang SM, et al. LNCaP progression model of human prostate cancer: androgen-independence and osseous metastasis. Prostate. 2000;44:91–103. - PubMed
    1. Deeb D, Gao X, Jiang H, Dulchavsky SA, Gautam SC. Oleanane triterpenoid CDDO-Me inhibits growth and induces apoptosis in prostate cancer cells by independently targeting pro-survival Akt and mTOR. Prostate. 2009;69:851–860. - PMC - PubMed
    1. Wolf P, Alt K, Bühler P, Katzenwadel A, Wetterauer U, et al. Anti-PSMA immunotoxin as novel treatment for prostate cancer? High and specific antitumor activity on human prostate xenograft tumors in SCID mice. Prostate. 2008;68:129–138. - PubMed

Publication types