

Metabolic changes in the visual cortex are linked to retinal nerve fiber layer thinning in multiple sclerosis
- PMID: 21494672
- PMCID: PMC3071815
- DOI: 10.1371/journal.pone.0018019
Metabolic changes in the visual cortex are linked to retinal nerve fiber layer thinning in multiple sclerosis
Abstract
Objective: To investigate the damage to the retinal nerve fiber layer as part of the anterior visual pathway as well as an impairment of the neuronal and axonal integrity in the visual cortex as part of the posterior visual pathway with complementary neuroimaging techniques, and to correlate our results to patients' clinical symptoms concerning the visual pathway.
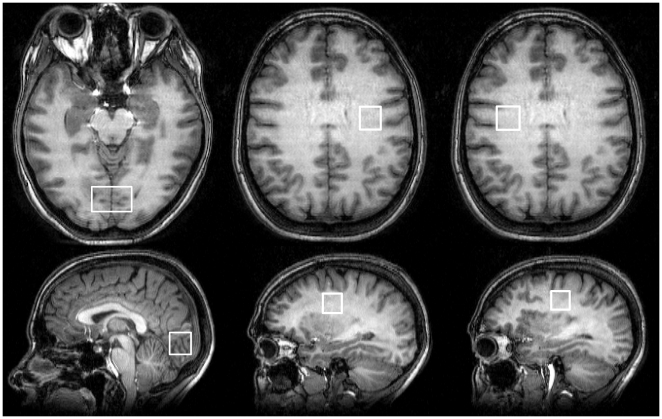
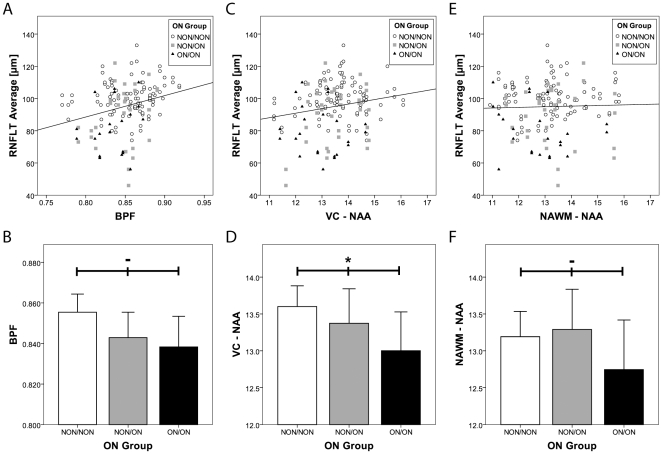
Design, subjects and methods: Survey of 86 patients with relapsing-remitting multiple sclerosis that were subjected to retinal nerve fiber layer thickness (RNFLT) measurement by optical coherence tomography, to a routine MRI scan including the calculation of the brain parenchymal fraction (BPF), and to magnetic resonance spectroscopy at 3 tesla, quantifying N-acetyl aspartate (NAA) concentrations in the visual cortex and normal-appearing white matter.
Results: RNFLT correlated significantly with BPF and visual cortex NAA, but not with normal-appearing white matter NAA. This was connected with the patients' history of a previous optic neuritis. In a combined model, both BPF and visual cortex NAA were independently associated with RNFLT.
Conclusions: Our data suggest the existence of functional pathway-specific damage patterns exceeding global neurodegeneration. They suggest a strong interrelationship between damage to the anterior and the posterior visual pathway.
Conflict of interest statement
Figures
Similar articles
-
The association between retinal nerve fibre layer thickness and N-acetyl aspartate levels in multiple sclerosis brain normal-appearing white matter: a longitudinal study using magnetic resonance spectroscopy and optical coherence tomography.Eur J Neurol. 2016 Dec;23(12):1769-1774. doi: 10.1111/ene.13116. Epub 2016 Sep 3. Eur J Neurol. 2016. PMID: 27591406
-
Axonal damage in the optic radiation assessed by white matter tract integrity metrics is associated with retinal thinning in multiple sclerosis.Neuroimage Clin. 2020;27:102293. doi: 10.1016/j.nicl.2020.102293. Epub 2020 May 26. Neuroimage Clin. 2020. PMID: 32563921 Free PMC article.
-
Association of retinal and macular damage with brain atrophy in multiple sclerosis.PLoS One. 2011 Apr 8;6(4):e18132. doi: 10.1371/journal.pone.0018132. PLoS One. 2011. PMID: 21494659 Free PMC article.
-
Optical Coherence Tomography and Magnetic Resonance Imaging in Multiple Sclerosis and Neuromyelitis Optica Spectrum Disorder.Int J Mol Sci. 2016 Nov 15;17(11):1894. doi: 10.3390/ijms17111894. Int J Mol Sci. 2016. PMID: 27854301 Free PMC article. Review.
-
Optic neuritis and multiple sclerosis.Curr Opin Neurol. 2008 Feb;21(1):16-21. doi: 10.1097/WCO.0b013e3282f419ca. Curr Opin Neurol. 2008. PMID: 18180647 Review.
Cited by
-
Optical coherence tomography assessment of axonal and neuronal damage of the retina in patients with familial and sporadic multiple sclerosis.Front Neurol. 2022 Sep 16;13:953188. doi: 10.3389/fneur.2022.953188. eCollection 2022. Front Neurol. 2022. PMID: 36188381 Free PMC article.
-
Mapping the accumulation of co-infiltrating CNS dendritic cells and encephalitogenic T cells during EAE.J Neuroimmunol. 2014 Dec 15;277(1-2):39-49. doi: 10.1016/j.jneuroim.2014.09.016. Epub 2014 Sep 28. J Neuroimmunol. 2014. PMID: 25288303 Free PMC article.
-
Ultrahigh field MRI in clinical neuroimmunology: a potential contribution to improved diagnostics and personalised disease management.EPMA J. 2015 Aug 27;6(1):16. doi: 10.1186/s13167-015-0038-y. eCollection 2015. EPMA J. 2015. PMID: 26312125 Free PMC article. Review.
-
Longitudinal time-domain optic coherence study of retinal nerve fiber layer in IFNβ-treated and untreated multiple sclerosis patients.Exp Ther Med. 2016 Jul;12(1):190-200. doi: 10.3892/etm.2016.3300. Epub 2016 Apr 27. Exp Ther Med. 2016. PMID: 27347038 Free PMC article.
-
Optic nerve head quantification in idiopathic intracranial hypertension by spectral domain OCT.PLoS One. 2012;7(5):e36965. doi: 10.1371/journal.pone.0036965. Epub 2012 May 15. PLoS One. 2012. PMID: 22615858 Free PMC article.
References
-
- Charcot JM. Histologie de la sclerose en plaques. Gazette des Hopitaux. 1868;141:554–558.
-
- Ropper AH, Brown RJ. McGraw-Hill Medical; 2005. Adams and Victor's Principles of Neurology. 8th edition.
-
- Trapp BD, Peterson J, Ransohoff RM, Rudick R, Mörk S, et al. Axonal transection in the lesions of multiple sclerosis. N Engl J Med. 1998;338:278–285. - PubMed
-
- Vogt J, Paul F, Aktas O, Müller-Wielsch K, Dörr J, et al. Lower motor neuron loss in multiple sclerosis and experimental autoimmune encephalomyelitis. Ann Neurol. 2009;66:310–322. - PubMed
-
- Barkhof F. The clinico-radiological paradox in multiple sclerosis revisited. Curr Opin Neurol. 2002;15:239–245. - PubMed
Publication types
MeSH terms
Substances
LinkOut - more resources
Full Text Sources
Other Literature Sources
Medical
