Vaccine potential of Nipah virus-like particles
- PMID: 21494680
- PMCID: PMC3071823
- DOI: 10.1371/journal.pone.0018437
Vaccine potential of Nipah virus-like particles
Abstract
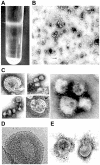
Nipah virus (NiV) was first recognized in 1998 in a zoonotic disease outbreak associated with highly lethal febrile encephalitis in humans and a predominantly respiratory disease in pigs. Periodic deadly outbreaks, documentation of person-to-person transmission, and the potential of this virus as an agent of agroterror reinforce the need for effective means of therapy and prevention. In this report, we describe the vaccine potential of NiV virus-like particles (NiV VLPs) composed of three NiV proteins G, F and M. Co-expression of these proteins under optimized conditions resulted in quantifiable amounts of VLPs with many virus-like/vaccine desirable properties including some not previously described for VLPs of any paramyxovirus: The particles were fusogenic, inducing syncytia formation; PCR array analysis showed NiV VLP-induced activation of innate immune defense pathways; the surface structure of NiV VLPs imaged by cryoelectron microscopy was dense, ordered, and repetitive, and consistent with similarly derived structure of paramyxovirus measles virus. The VLPs were composed of all the three viral proteins as designed, and their intracellular processing also appeared similar to NiV virions. The size, morphology and surface composition of the VLPs were consistent with the parental virus, and importantly, they retained their antigenic potential. Finally, these particles, formulated without adjuvant, were able to induce neutralizing antibody response in Balb/c mice. These findings indicate vaccine potential of these particles and will be the basis for undertaking future protective efficacy studies in animal models of NiV disease.
Conflict of interest statement
Figures


Similar articles
-
Structure-Based Design of Nipah Virus Vaccines: A Generalizable Approach to Paramyxovirus Immunogen Development.Front Immunol. 2020 Jun 11;11:842. doi: 10.3389/fimmu.2020.00842. eCollection 2020. Front Immunol. 2020. PMID: 32595632 Free PMC article.
-
Recombinant measles virus vaccine expressing the Nipah virus glycoprotein protects against lethal Nipah virus challenge.PLoS One. 2013;8(3):e58414. doi: 10.1371/journal.pone.0058414. Epub 2013 Mar 14. PLoS One. 2013. PMID: 23516477 Free PMC article.
-
A highly effective ferritin-based divalent nanoparticle vaccine shields Syrian hamsters against lethal Nipah virus.Front Immunol. 2024 Jun 6;15:1387811. doi: 10.3389/fimmu.2024.1387811. eCollection 2024. Front Immunol. 2024. PMID: 38911870 Free PMC article.
-
Nipah virus: epidemiology, pathology, immunobiology and advances in diagnosis, vaccine designing and control strategies - a comprehensive review.Vet Q. 2019 Dec;39(1):26-55. doi: 10.1080/01652176.2019.1580827. Vet Q. 2019. PMID: 31006350 Free PMC article. Review.
-
Recent Advances in Immunological Landscape and Immunotherapeutic Agent of Nipah Virus Infection.Cell Biochem Biophys. 2024 Dec;82(4):3053-3069. doi: 10.1007/s12013-024-01424-4. Epub 2024 Jul 25. Cell Biochem Biophys. 2024. PMID: 39052192 Review.
Cited by
-
Vaccines to Emerging Viruses: Nipah and Hendra.Annu Rev Virol. 2020 Sep 29;7(1):447-473. doi: 10.1146/annurev-virology-021920-113833. Annu Rev Virol. 2020. PMID: 32991264 Free PMC article.
-
Single amino acid substitution in Hendra virus attachment glycoprotein induces cross-neutralizing antibodies against Nipah virus.Signal Transduct Target Ther. 2025 Aug 29;10(1):276. doi: 10.1038/s41392-025-02370-0. Signal Transduct Target Ther. 2025. PMID: 40877258 Free PMC article.
-
Medical countermeasures against henipaviruses: a review and public health perspective.Lancet Infect Dis. 2022 Jan;22(1):e13-e27. doi: 10.1016/S1473-3099(21)00400-X. Epub 2021 Nov 1. Lancet Infect Dis. 2022. PMID: 34735799 Free PMC article. Review.
-
Early Activation of Primary Brain Microvascular Endothelial Cells by Nipah Virus Glycoprotein-Containing Particles.J Virol. 2015 Dec 16;90(5):2706-9. doi: 10.1128/JVI.02825-15. J Virol. 2015. PMID: 26676791 Free PMC article.
-
Virus-like particles: preparation, immunogenicity and their roles as nanovaccines and drug nanocarriers.J Nanobiotechnology. 2021 Feb 25;19(1):59. doi: 10.1186/s12951-021-00806-7. J Nanobiotechnology. 2021. PMID: 33632278 Free PMC article. Review.
References
-
- Chua KB, Goh KJ, Wong KT, Kamarulzaman A, Tan PS, et al. Fatal encephalitis due to Nipah virus among pig-farmers in Malaysia. Lancet. 1999;354:1257–1259. - PubMed
-
- Chua KB, Bellini WJ, Rota PA, Harcourt BH, Tamin A, et al. Nipah virus: a recently emergent deadly paramyxovirus. Science. 2000;288:1432–1435. - PubMed
-
- Chua KB. Nipah virus outbreak in Malaysia. J Clin Virol. 2003;26:265–275. - PubMed
Publication types
MeSH terms
Substances
Grants and funding
LinkOut - more resources
Full Text Sources

