. 2011 Apr 6;6(4):e18455.
doi: 10.1371/journal.pone.0018455.

Genetic and metabolic characterization of insomnia

Affiliations

Genetic and metabolic characterization of insomnia

Hyo-Jeong Ban et al. PLoS One. .

Abstract

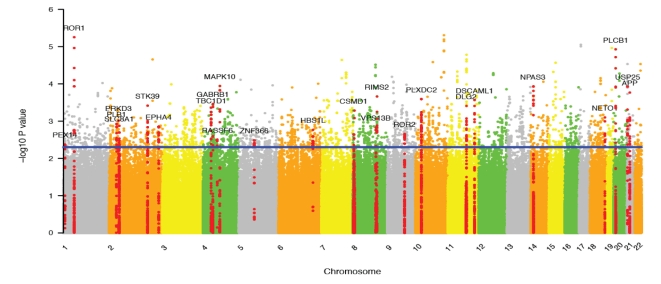
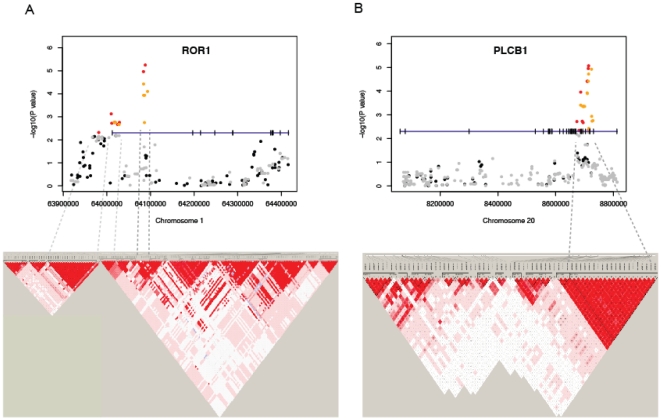
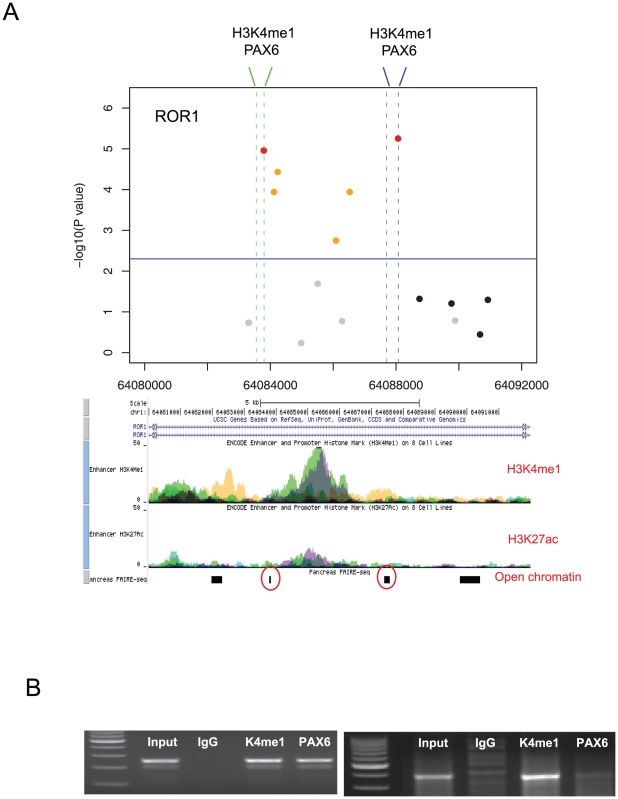
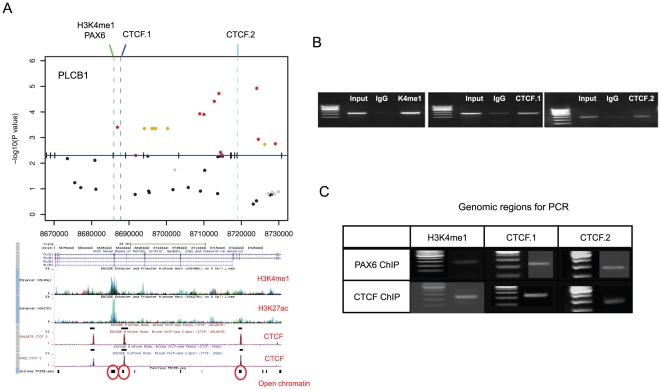
Insomnia is reported to chronically affect 10∼15% of the adult population. However, very little is known about the genetics and metabolism of insomnia. Here we surveyed 10,038 Korean subjects whose genotypes have been previously profiled on a genome-wide scale. About 16.5% reported insomnia and displayed distinct metabolic changes reflecting an increase in insulin secretion, a higher risk of diabetes, and disrupted calcium signaling. Insomnia-associated genotypic differences were highly concentrated within genes involved in neural function. The most significant SNPs resided in ROR1 and PLCB1, genes known to be involved in bipolar disorder and schizophrenia, respectively. Putative enhancers, as indicated by the histone mark H3K4me1, were discovered within both genes near the significant SNPs. In neuronal cells, the enhancers were bound by PAX6, a neural transcription factor that is essential for central nervous system development. Open chromatin signatures were found on the enhancers in human pancreas, a tissue where PAX6 is known to play a role in insulin secretion. In PLCB1, CTCF was found to bind downstream of the enhancer and interact with PAX6, suggesting that it can probably inhibit gene activation by PAX6. PLCB4, a circadian gene that is closely located downstream of PLCB1, was identified as a candidate target gene. Hence, dysregulation of ROR1, PLCB1, or PLCB4 by PAX6 and CTCF may be one mechanism that links neural and pancreatic dysfunction not only in insomnia but also in the relevant psychiatric disorders that are accompanied with circadian rhythm disruption and metabolic syndrome.


Conflict of interest statement

Competing Interests: JS is an employee of Omicsis, Inc. However, this does not alter adherence to all the journal's policies on sharing data and materials.

Figures

Figure 1
Figure 1. Percentages of sleepers who (A) have difficulty falling asleep, (B) wake up during the night and not be able to fall back asleep, (C) wake up too early in the morning, (D) have irregular sleeping time, (E) have received sleep treatment, (F) have taken sleeping medicine, (G) have the symptoms of restless legs syndrome, and (H) have experienced periodic limb movements during sleep.
White bars represent the normal and gray the insomniac group.
Figure 2
Figure 2. Manhattan plot for genetic association of insomnia.
The name of the genes harboring more than 10 significant SNPs is shown at the corresponding chromosomal position. The SNPs residing in these genes are shown as red dots.
Figure 3
Figure 3. P value plots, genomic structures and LD maps of (A) the ROR1 gene and (B) the PLCB1 gene.
The –log10 of the association P value of each SNP was plotted according to its chromosomal position. The gene structure was drawn at P = 5×10⁻³ with the vertical ticks indicating exons, and the SNPs above this threshold were colored red (experimental) or orange (imputed) and those below it black (experimental) or gray (imputed). The promoter region was attached to the ROR1 genebody to show the SNPs near the transcription start site. The LD maps based on D' were drawn by Haploview using the genotype data of all cases.
Figure 4
Figure 4. Zoomed-in P value plot and chromatin signatures for the ROR1 region.
(A) The vertical dotted lines indicate the DNA regions selected for H3K4me1 and PAX6 ChIP PCR. Below is the UCSC Genome Browser screen for the corresponding region showing H3K4me1 and H3K27ac in multiple cell lines. Open chromatin signatures in human pancreatic islets were employed from published data . (B) The results of ChIP PCR for H3K4me1 and PAX6 in the two regions. Input DNA and IgG antibody were used as positive and negative controls, respectively.
Figure 5
Figure 5. Zoomed-in P value plot and chromatin signatures for the PLCB1 region.
(A) The dotted lines indicate the DNA regions selected for H3K4me1, PAX6, and CTCF ChIP PCR. Below is the UCSC Genome Browser screen showing H3K4me1, H3K27ac, and CTCF. Corresponding open chromatin is shown. (B) The results of ChIP PCR for H3K4me1, PAX6, and CTCF. Input DNA and IgG were used as control. (C) Cross ChIP PCR between PAX6 and CTCF. PAX6 ChIP DNA was detected in the two CTCF sites, and CTCF ChIP DNA was detected in the PAX6 site.

References

    1. He Y, Jones CR, Fujiki N, Xu Y, Guo B, et al. The transcriptional repressor DEC2 regulates sleep length in mammals. Science. 2009;325:866–870. - PMC - PubMed
    1. Gottlieb DJ, O'Connor GT, Wilk JB. Genome-wide association of sleep and circadian phenotypes. BMC Med Genet. 2007;8(Suppl 1):S9. - PMC - PubMed
    1. Winkelmann J, Schormair B, Lichtner P, Ripke S, Xiong L, et al. Genome-wide association study of restless legs syndrome identifies common variants in three genomic regions. Nat Genet. 2007;39:1000–1006. - PubMed
    1. Schormair B, Kemlink D, Roeske D, Eckstein G, Xiong L, et al. PTPRD (protein tyrosine phosphatase receptor type delta) is associated with restless legs syndrome. Nat Genet. 2008;40:946–948. - PubMed
    1. Watson NF, Goldberg J, Arguelles L, Buchwald D. Genetic and environmental influences on insomnia, daytime sleepiness, and obesity in twins. Sleep. 2006;29:645–649. - PubMed

Publication types

MeSH terms